Century 21 People’s Choice Realty Inc., Brokerage
120 MATHESON BLVD E #103
MISSISSAUGA, Ontario
L4K 0A4
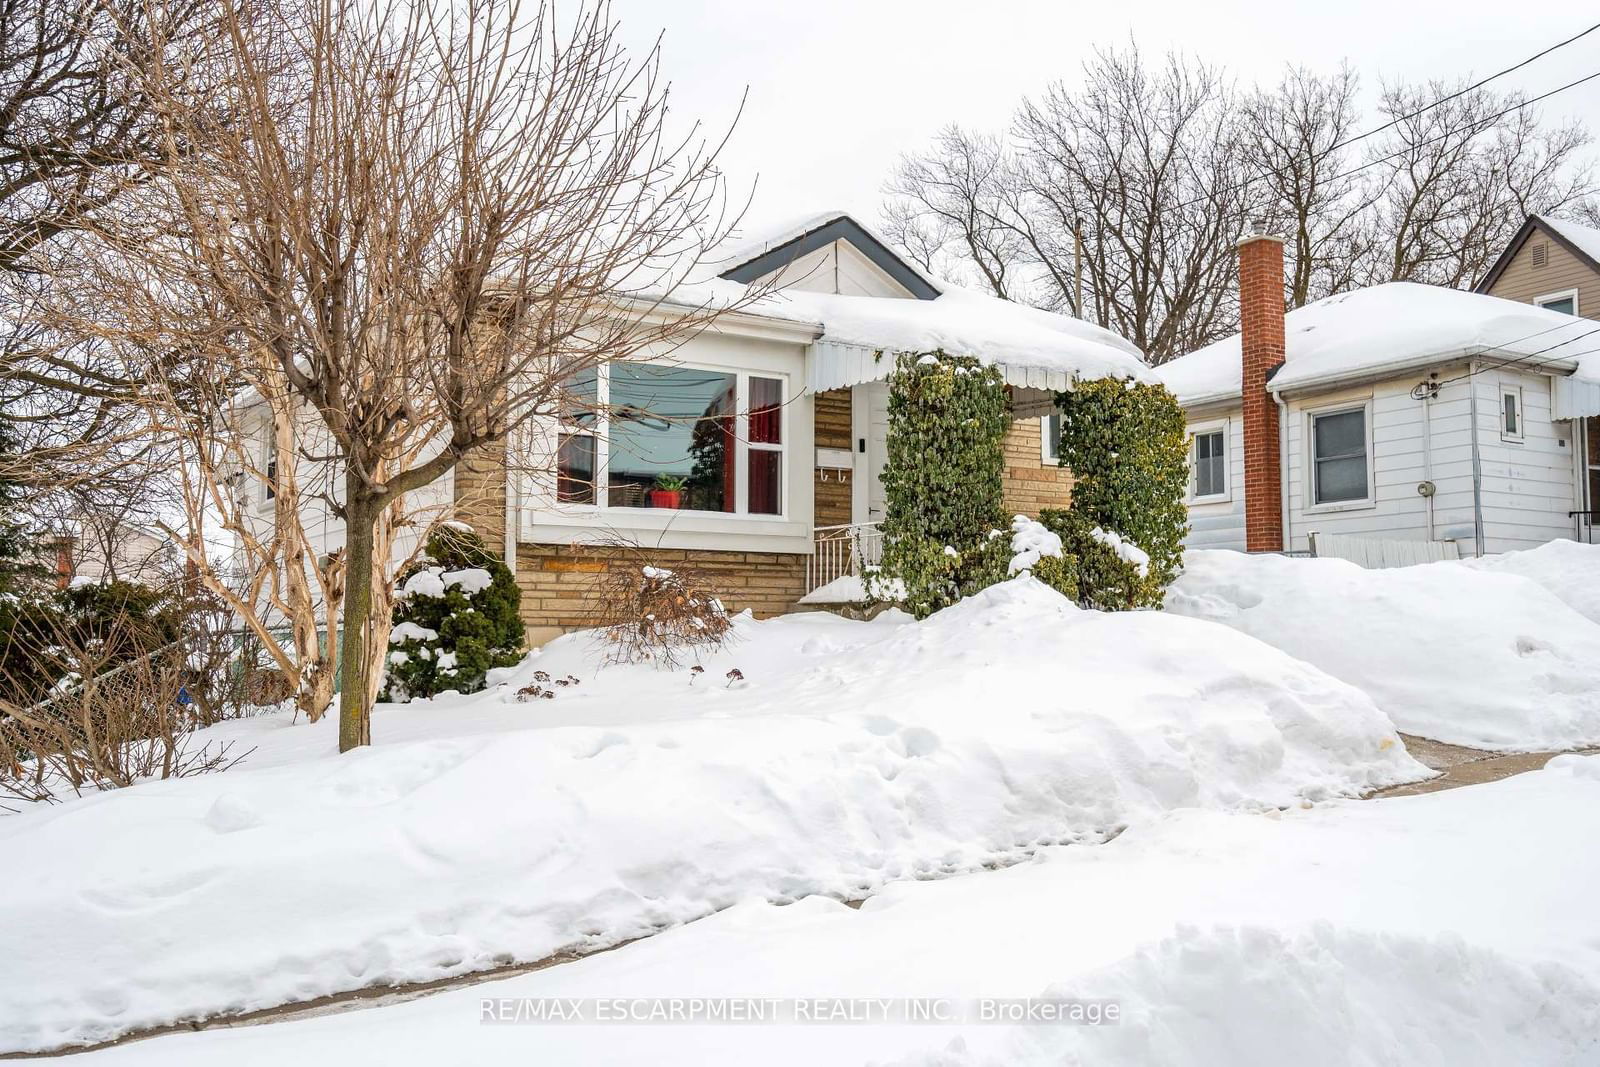
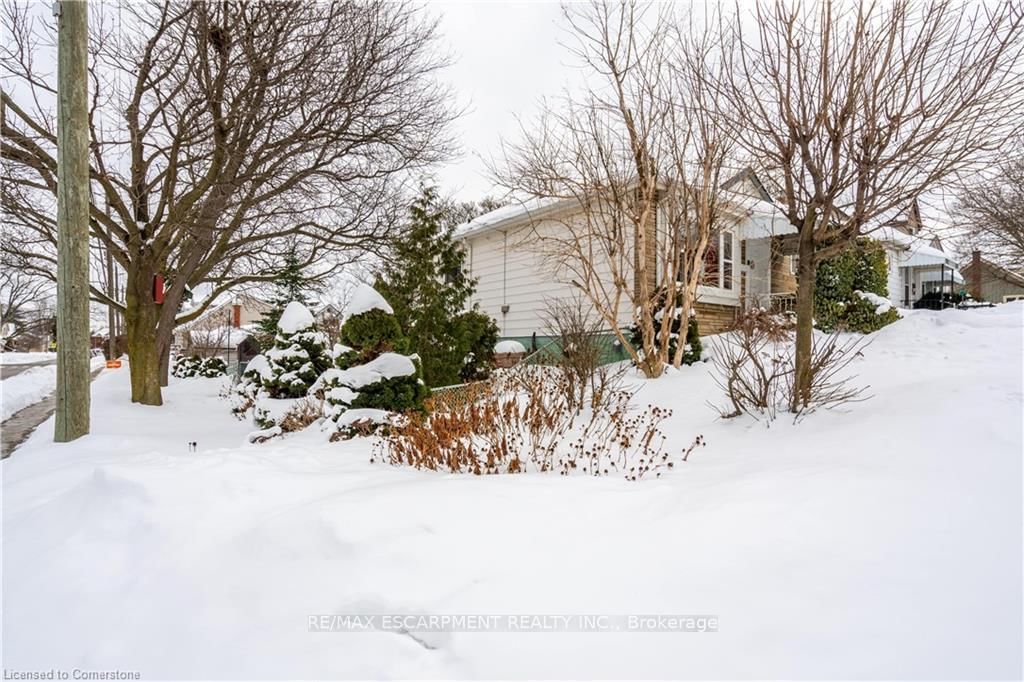


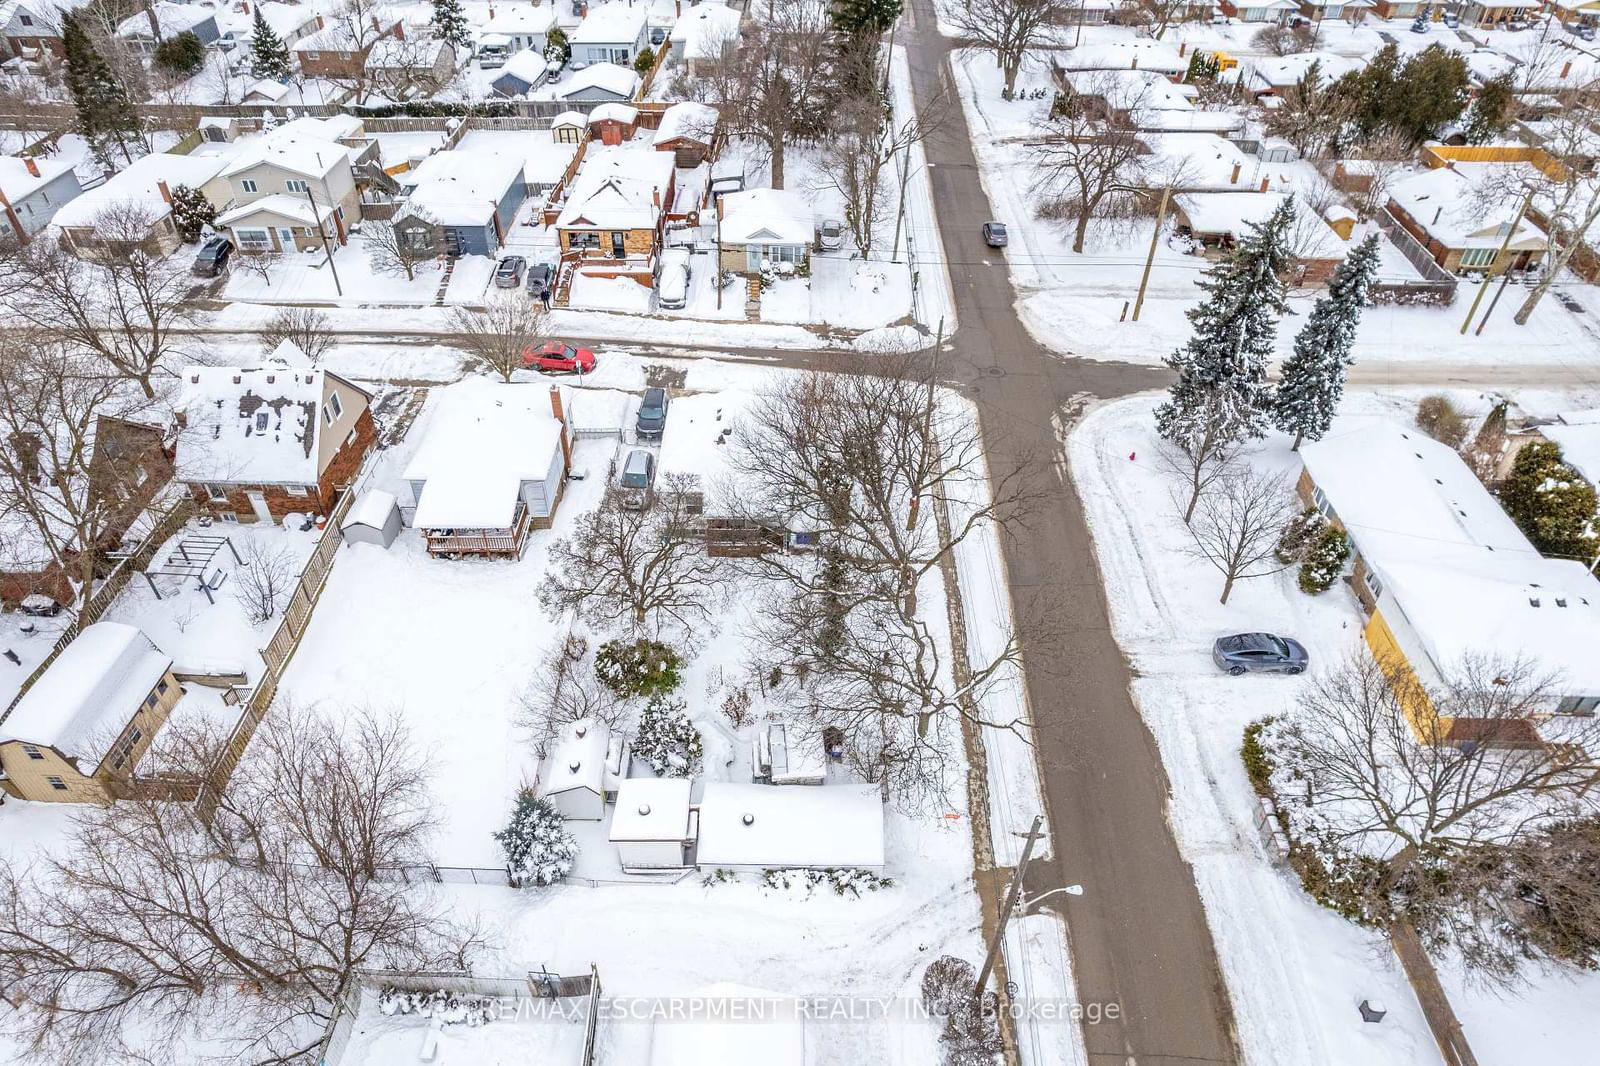
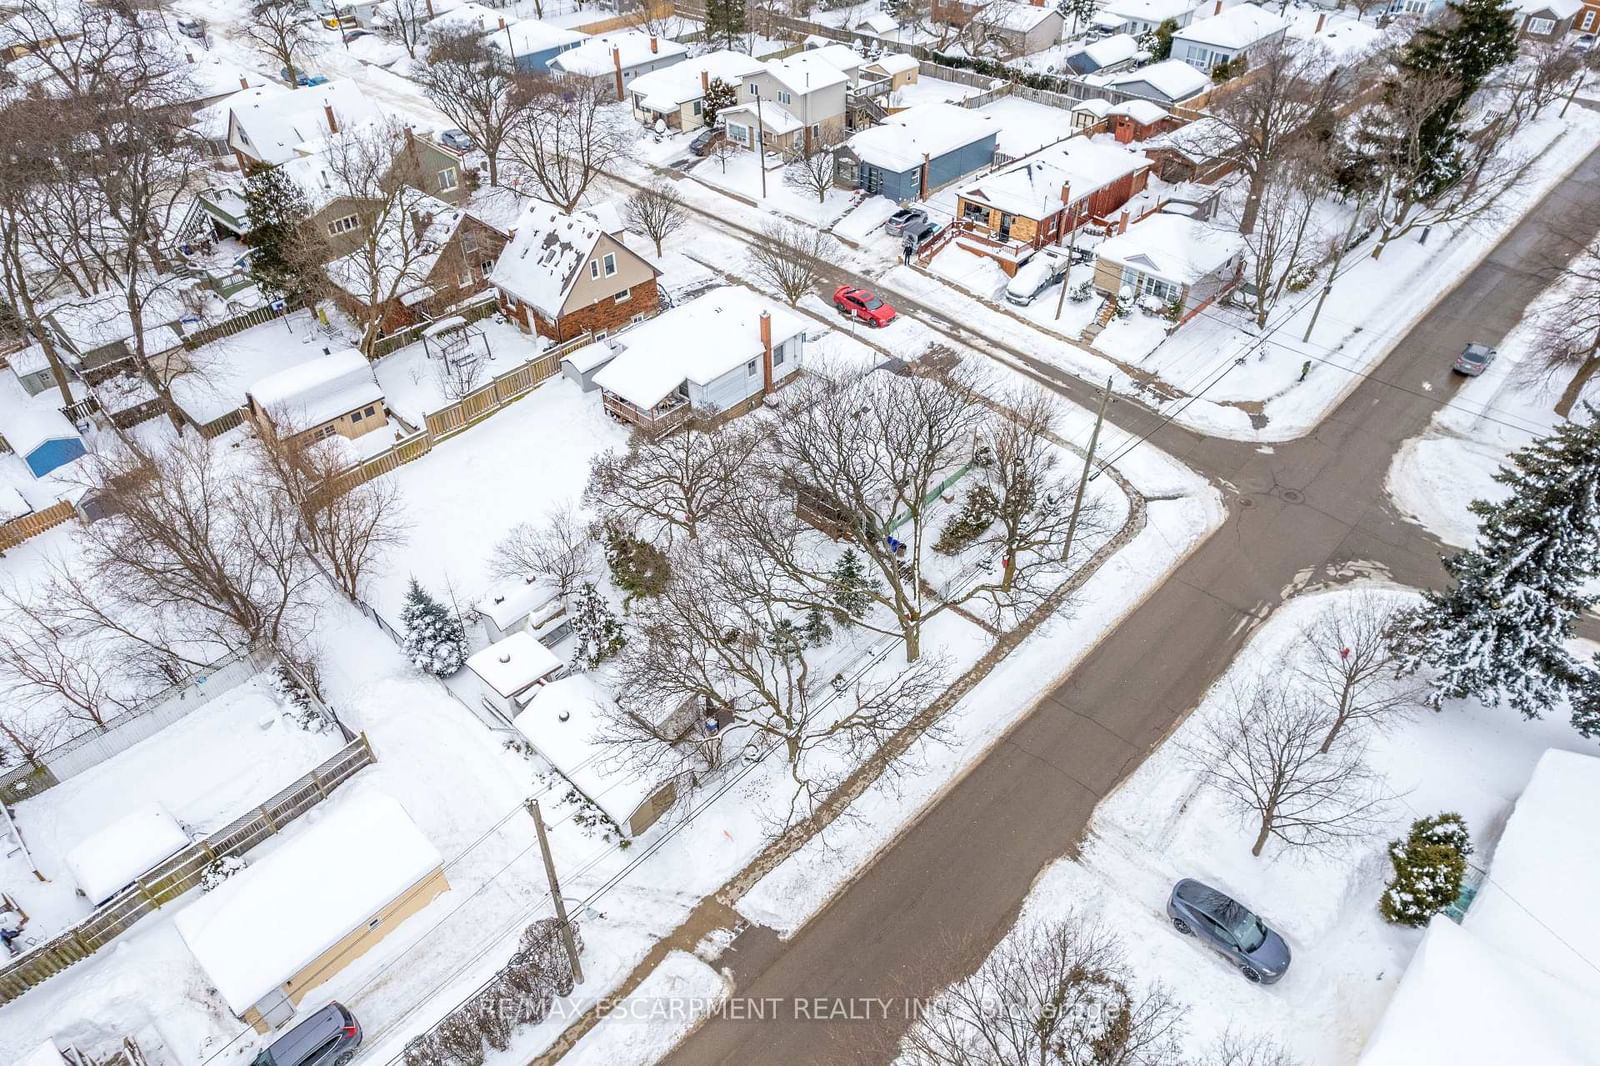


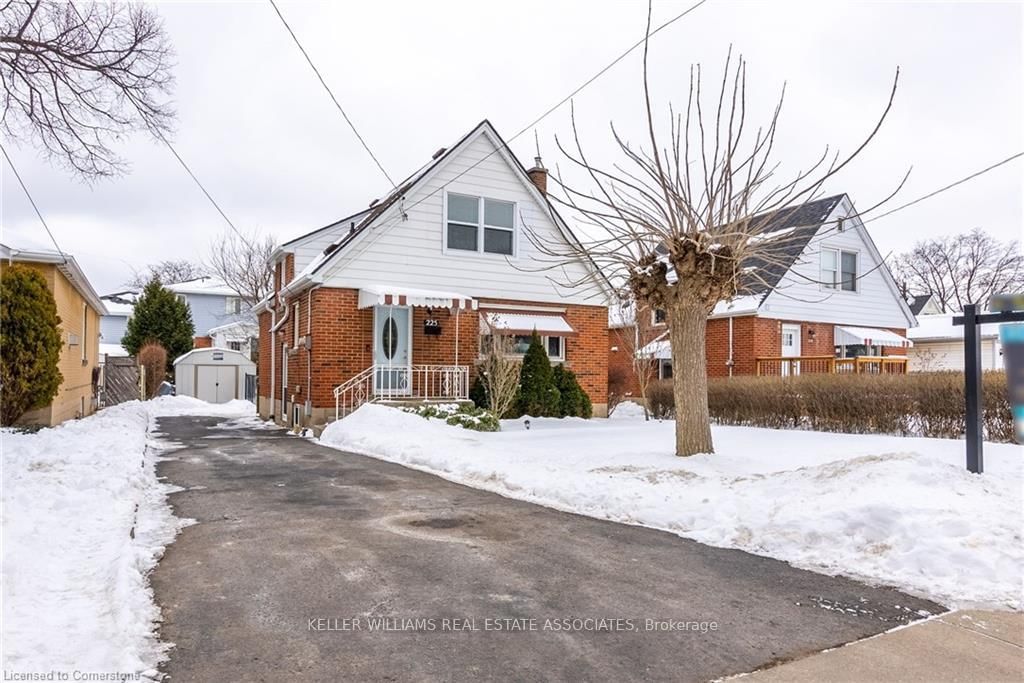
Hamilton, Inch Park, L9A 4M4
$639,000
Listed by RE/MAX ESCARPMENT REALTY INC..
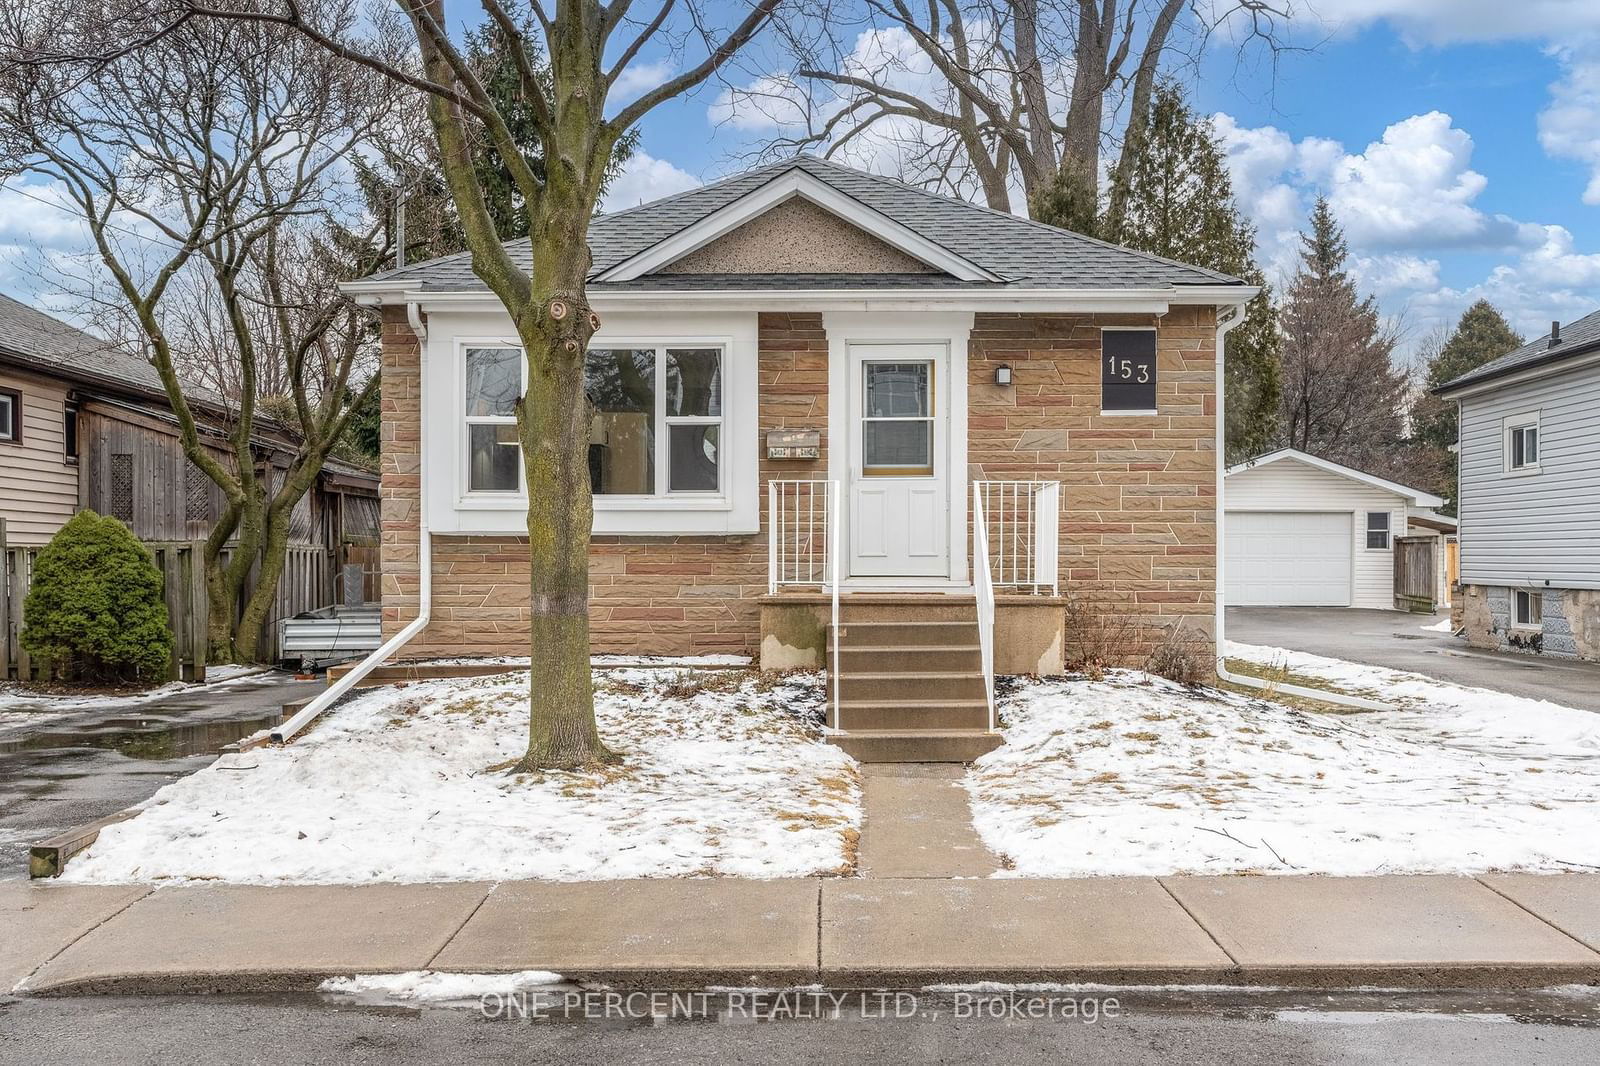
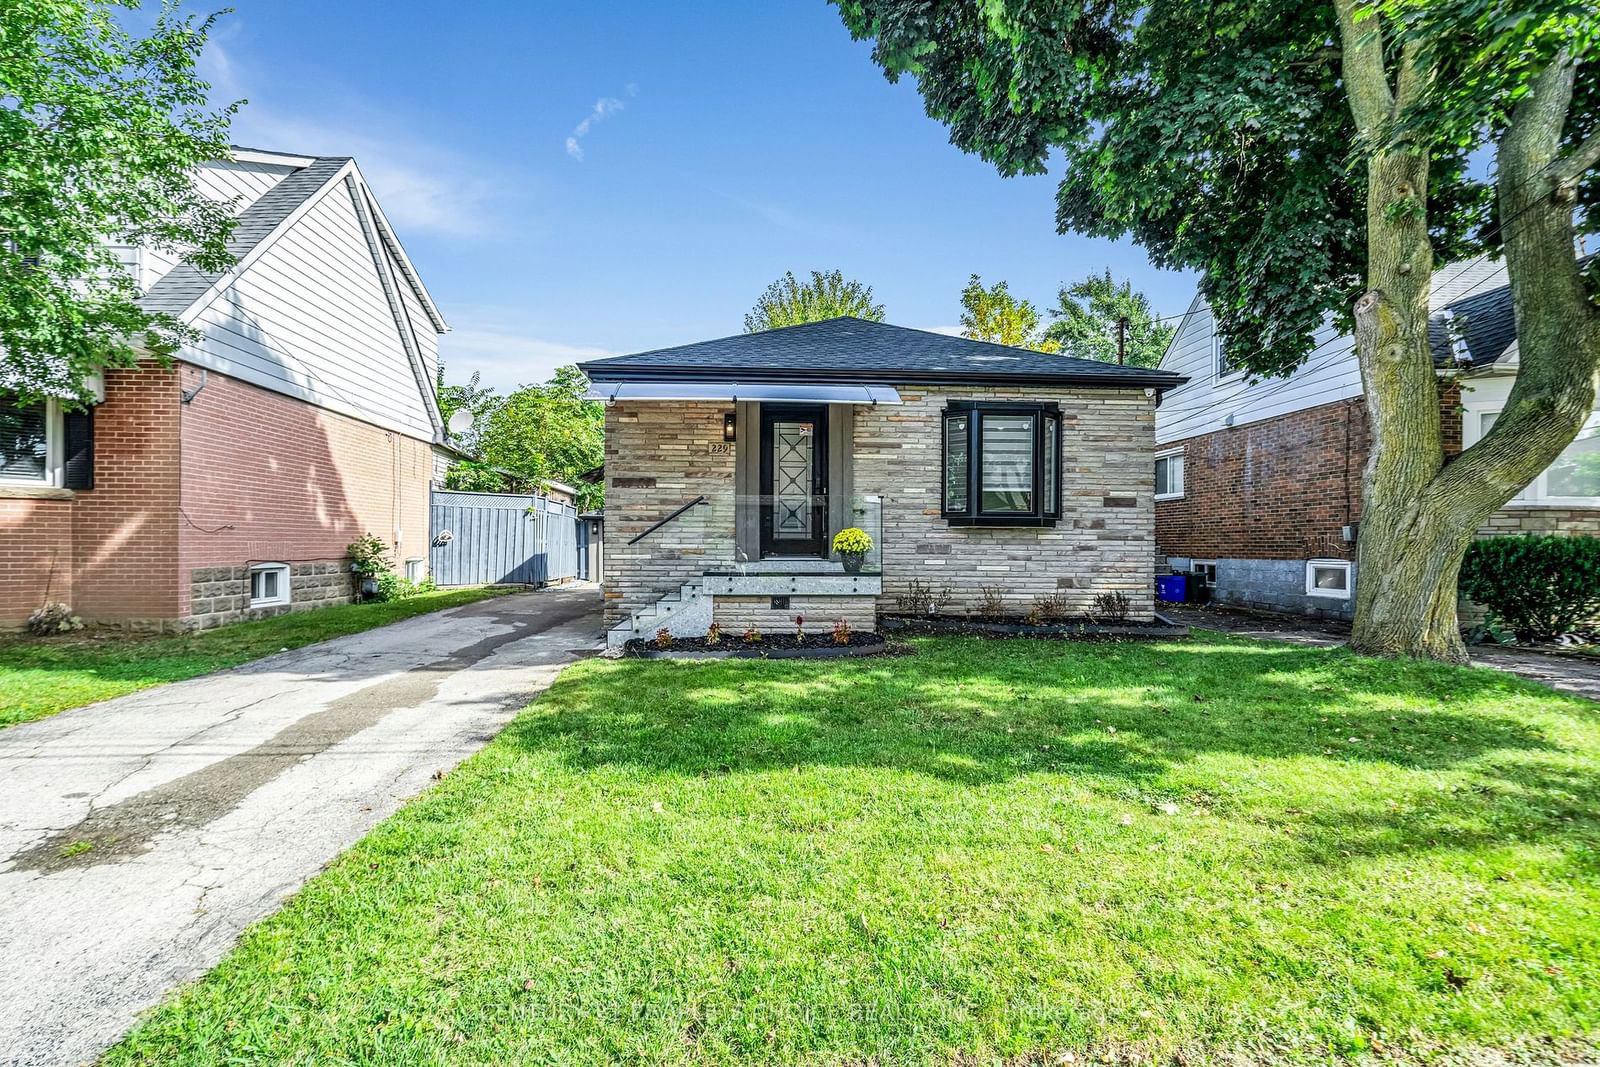
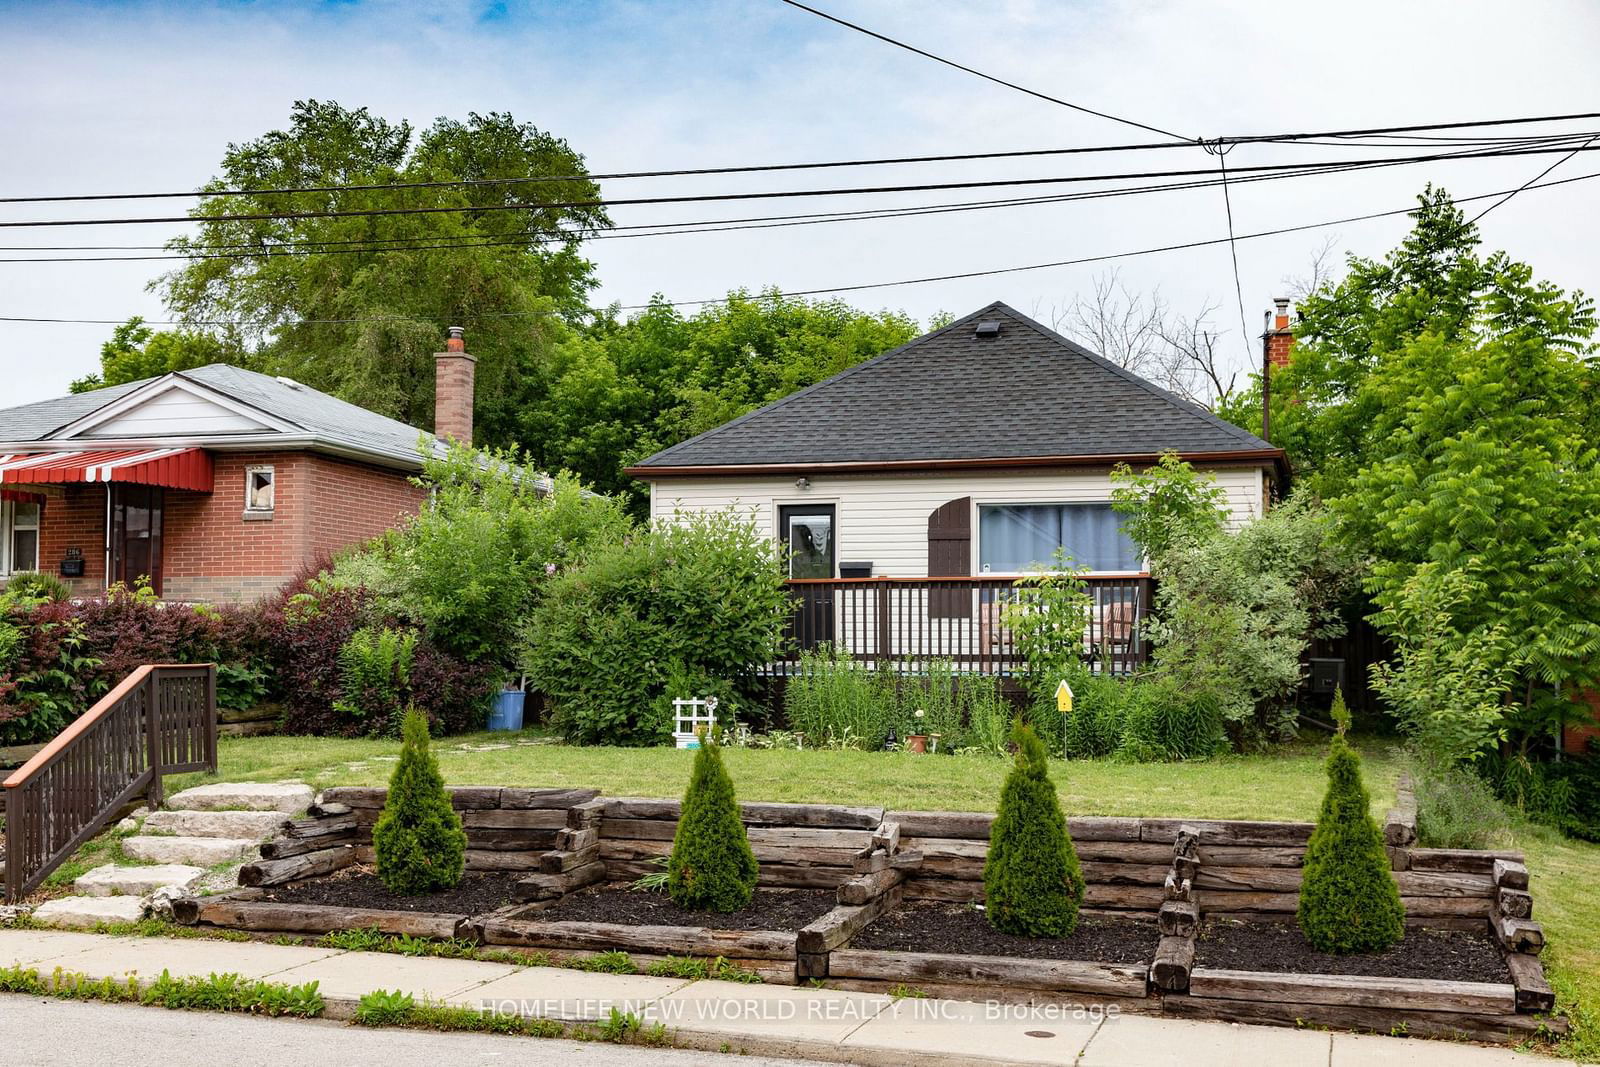
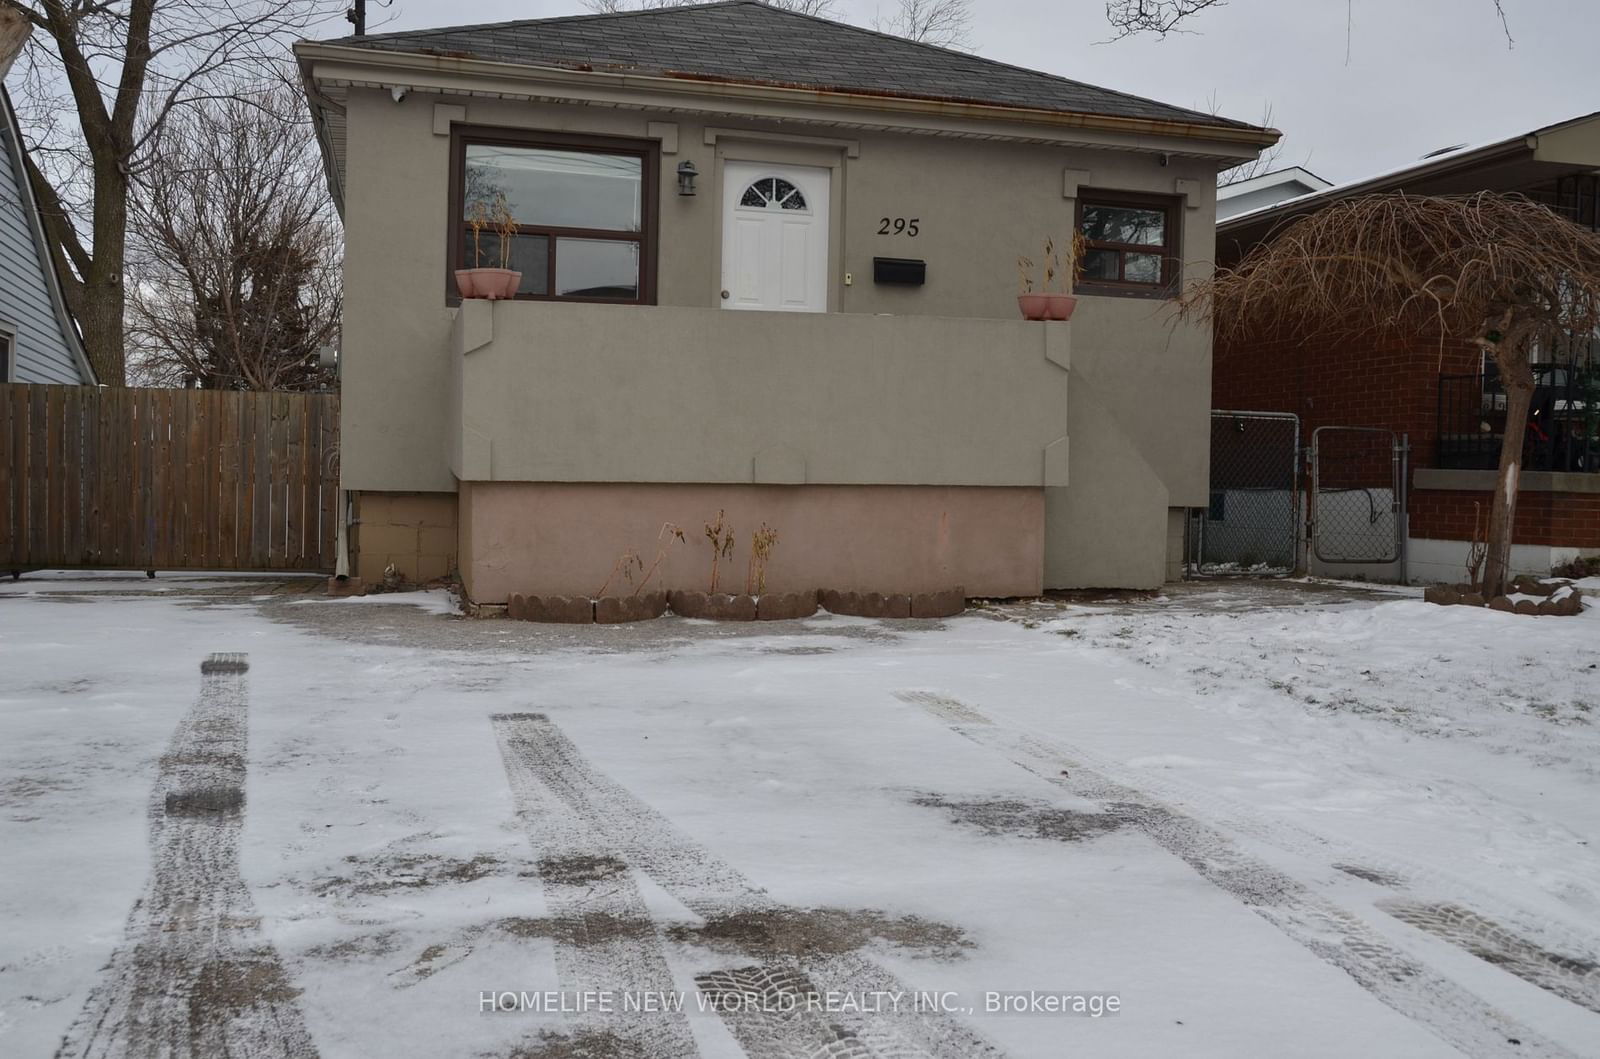
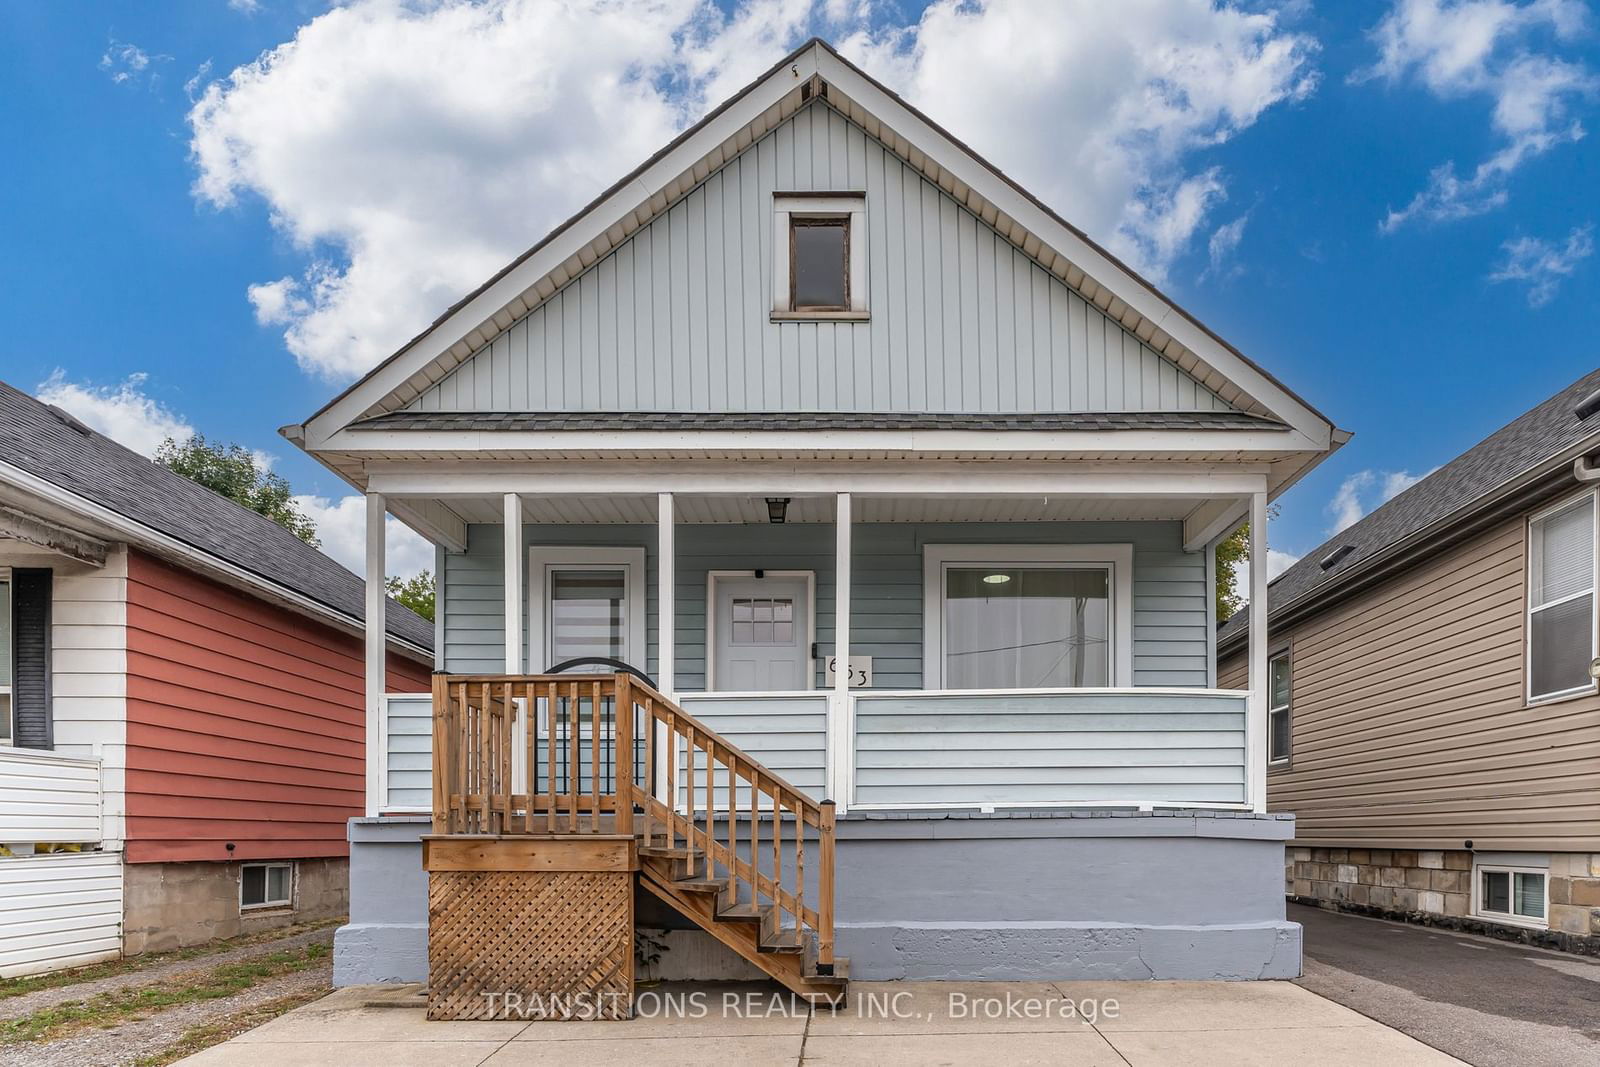
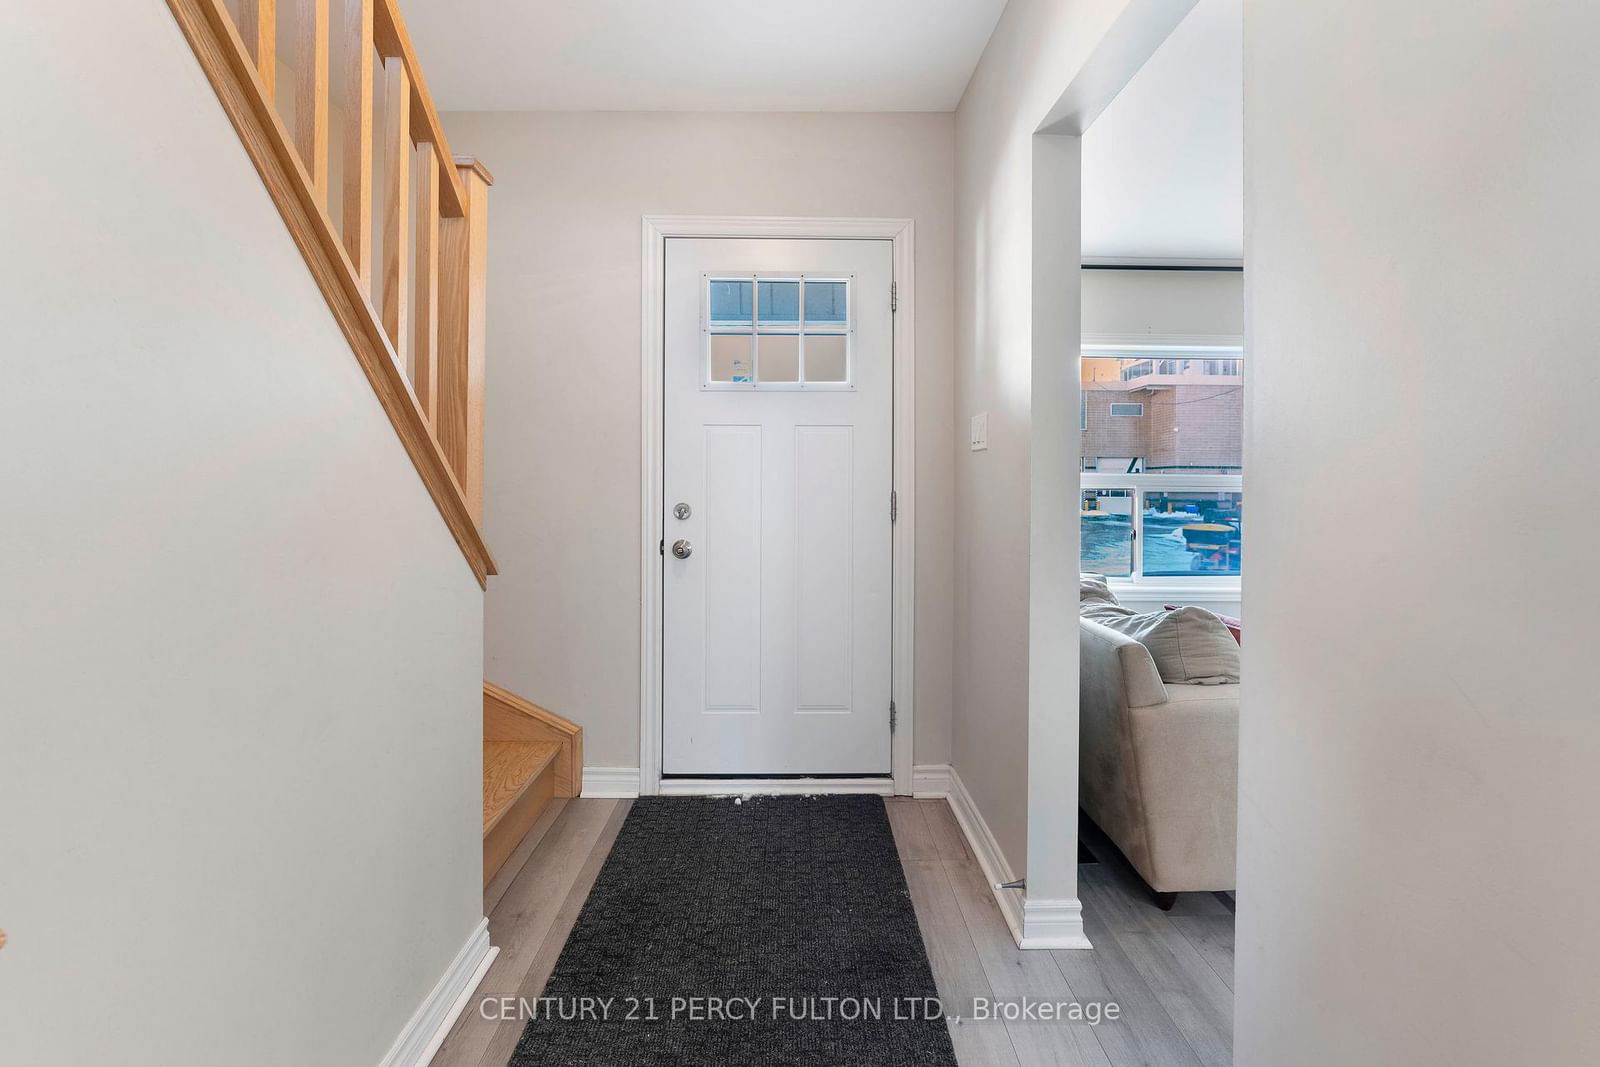
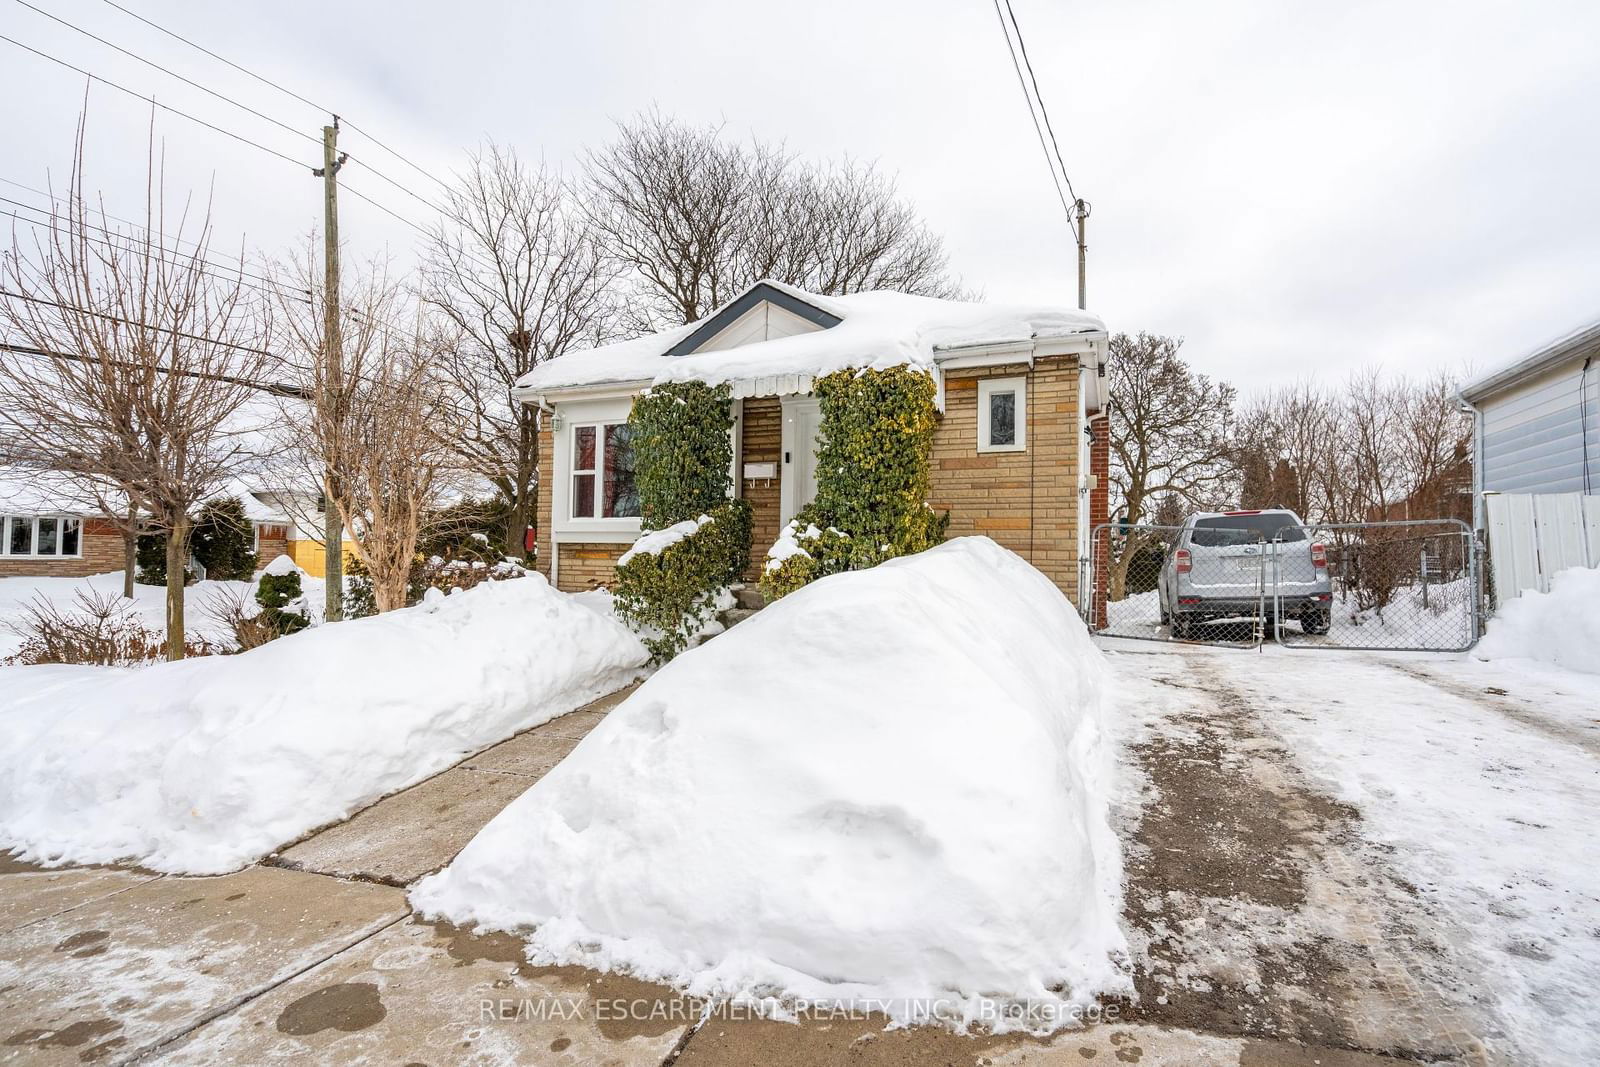
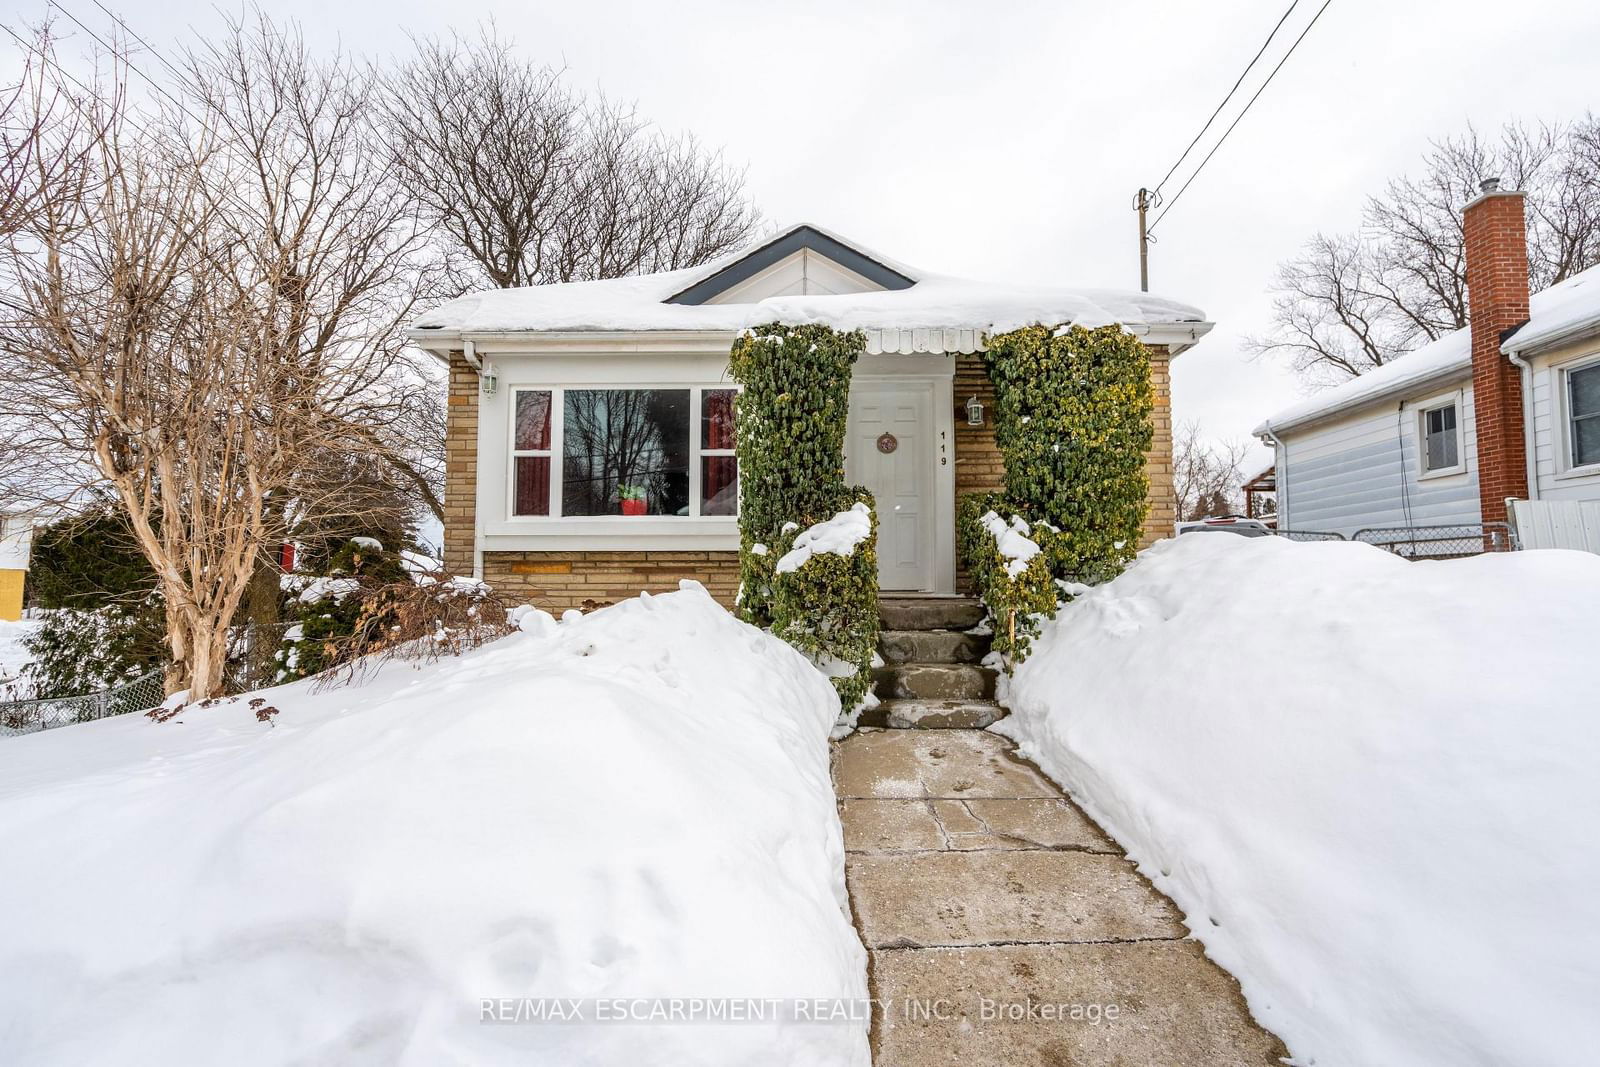
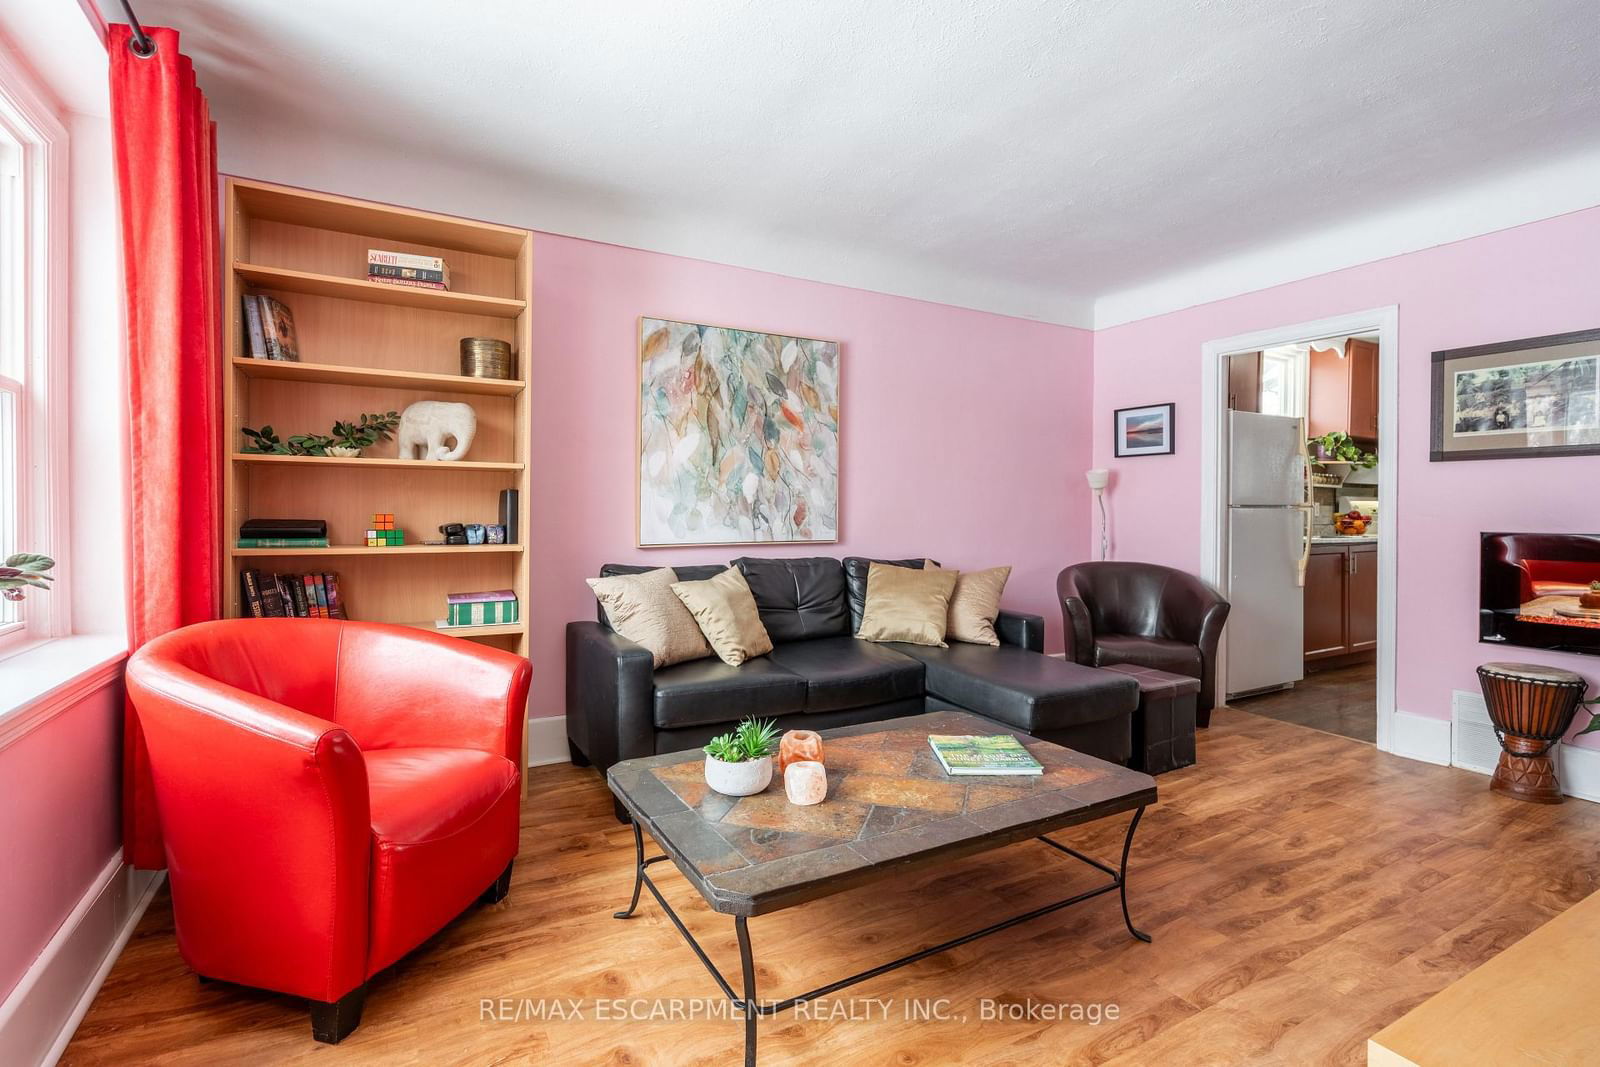
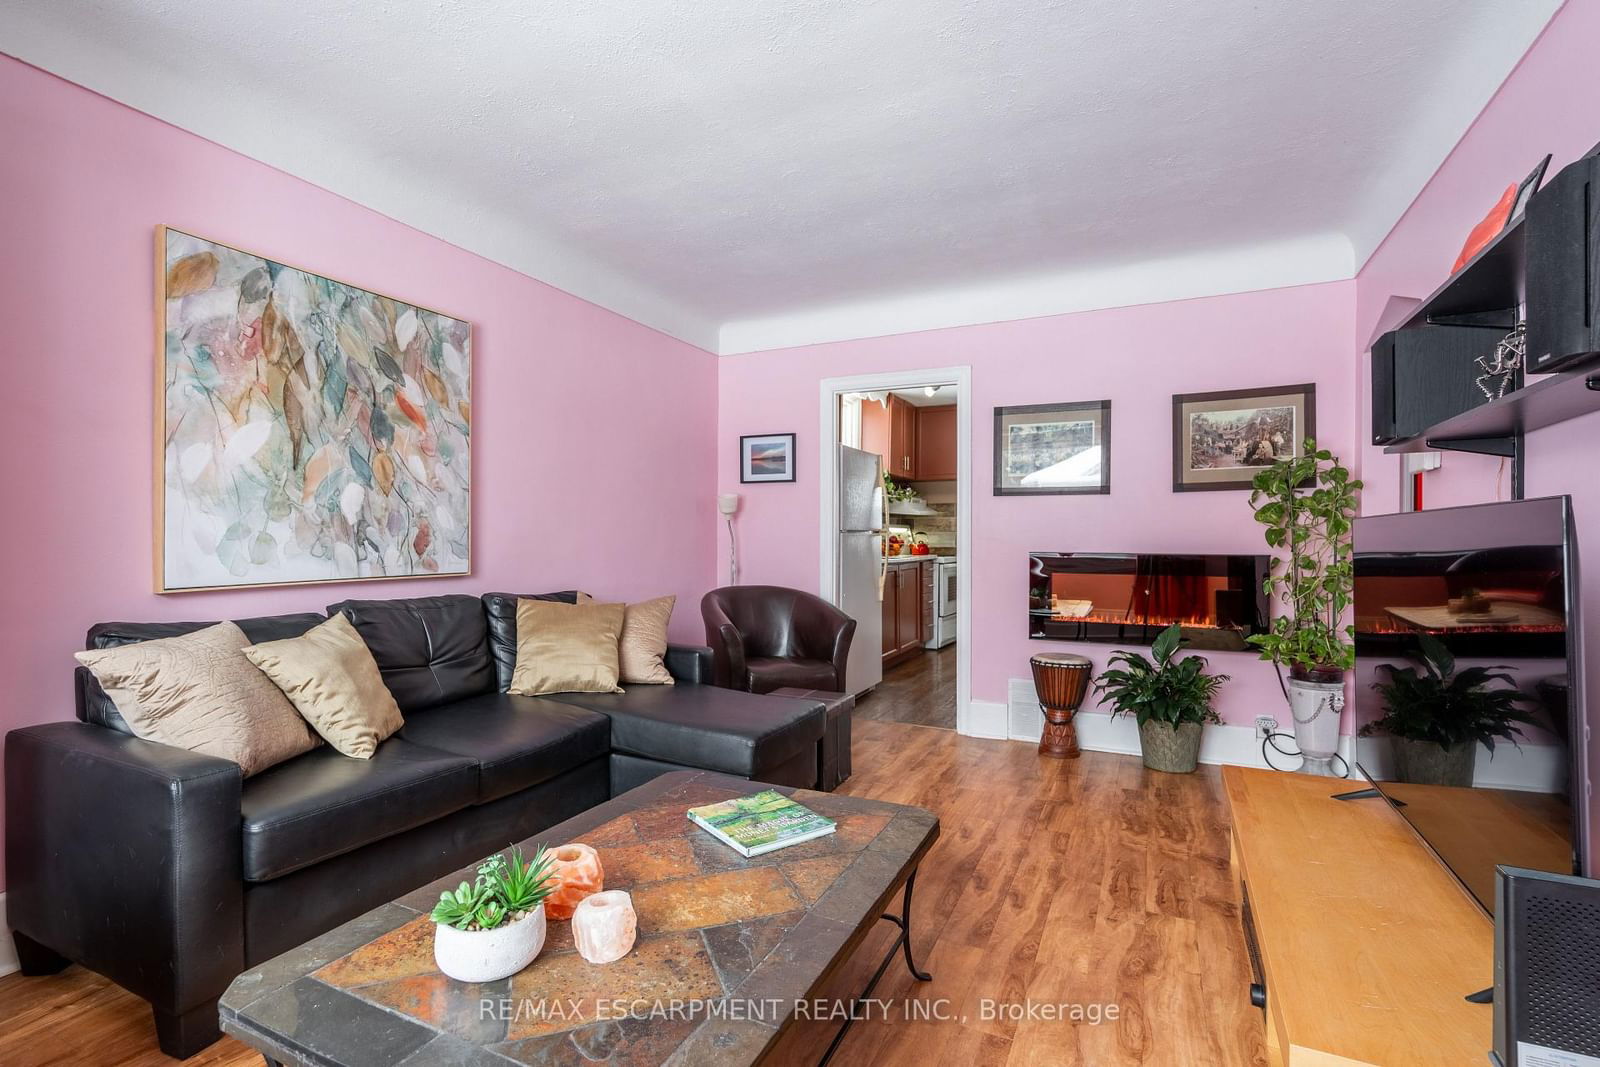
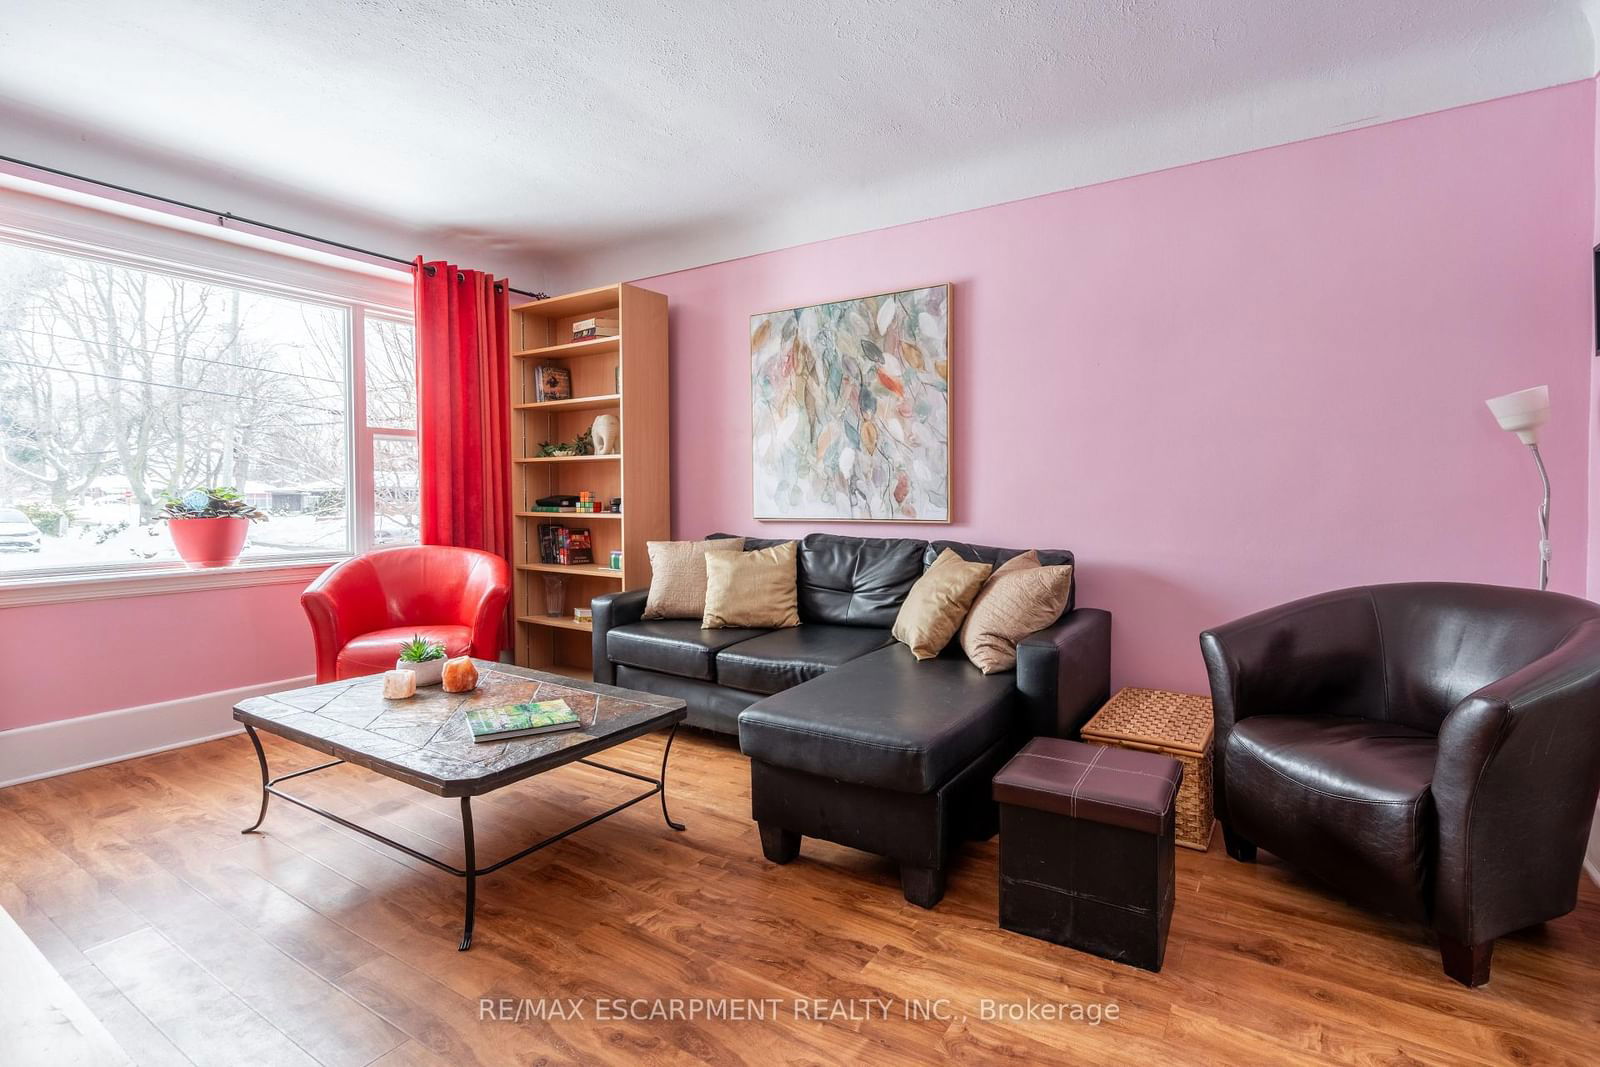
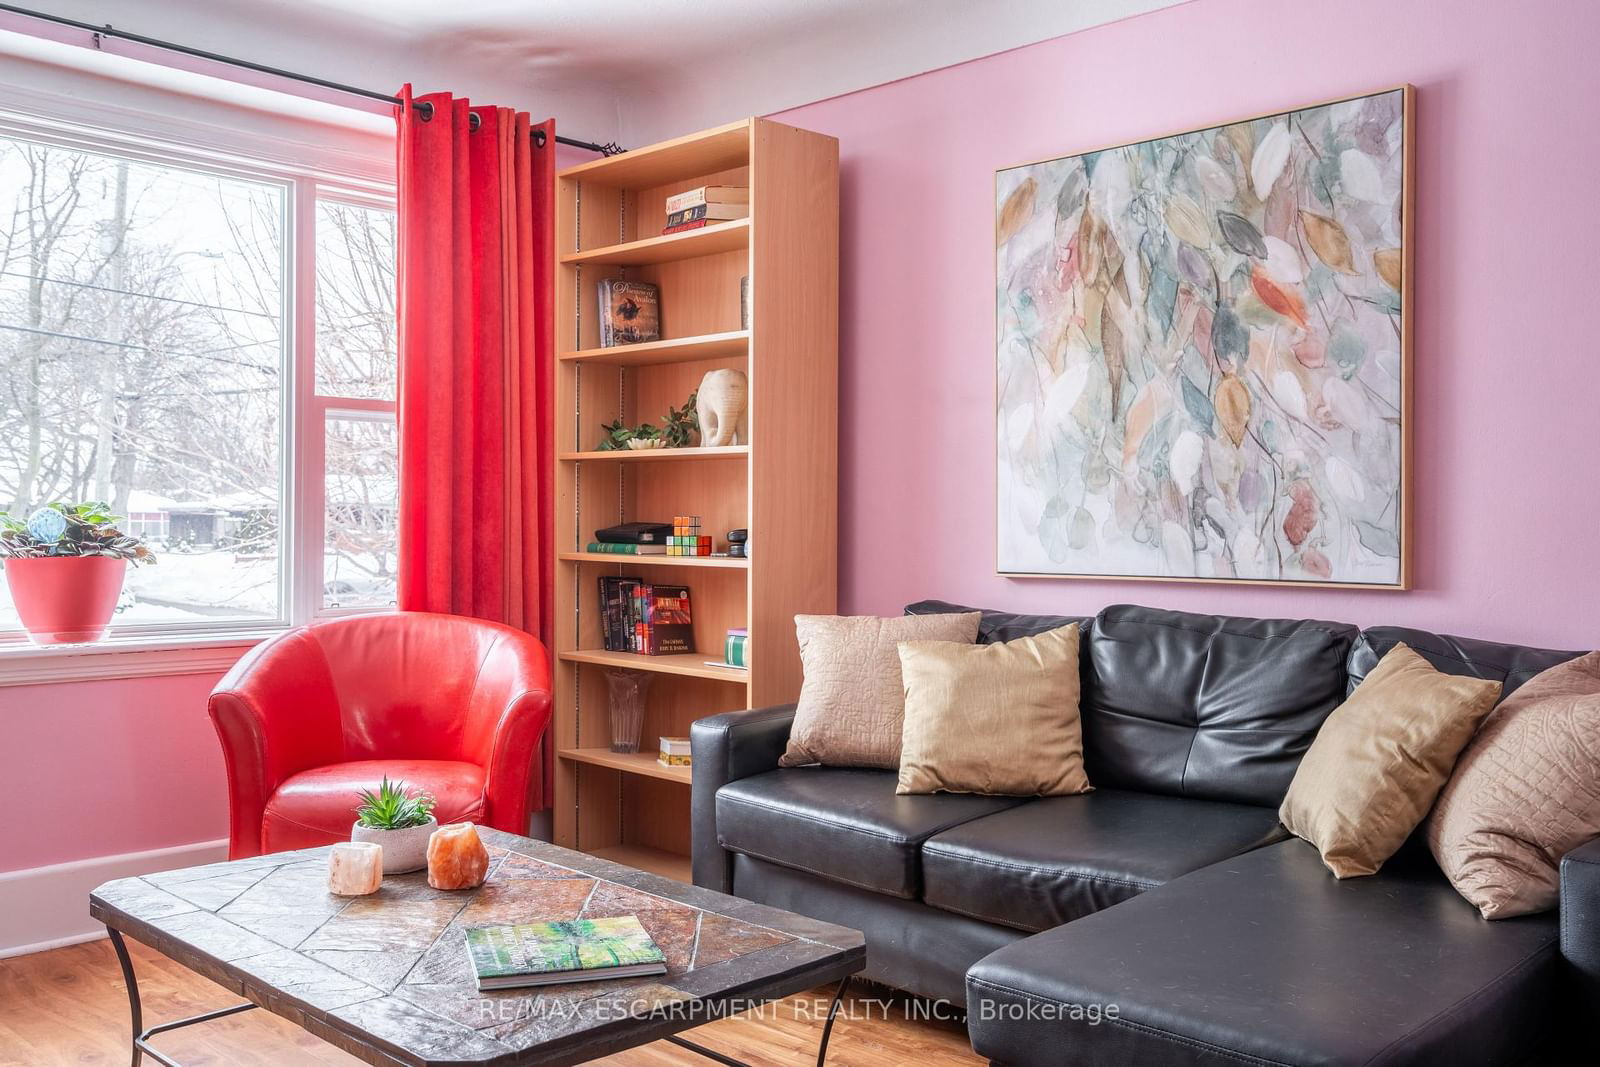
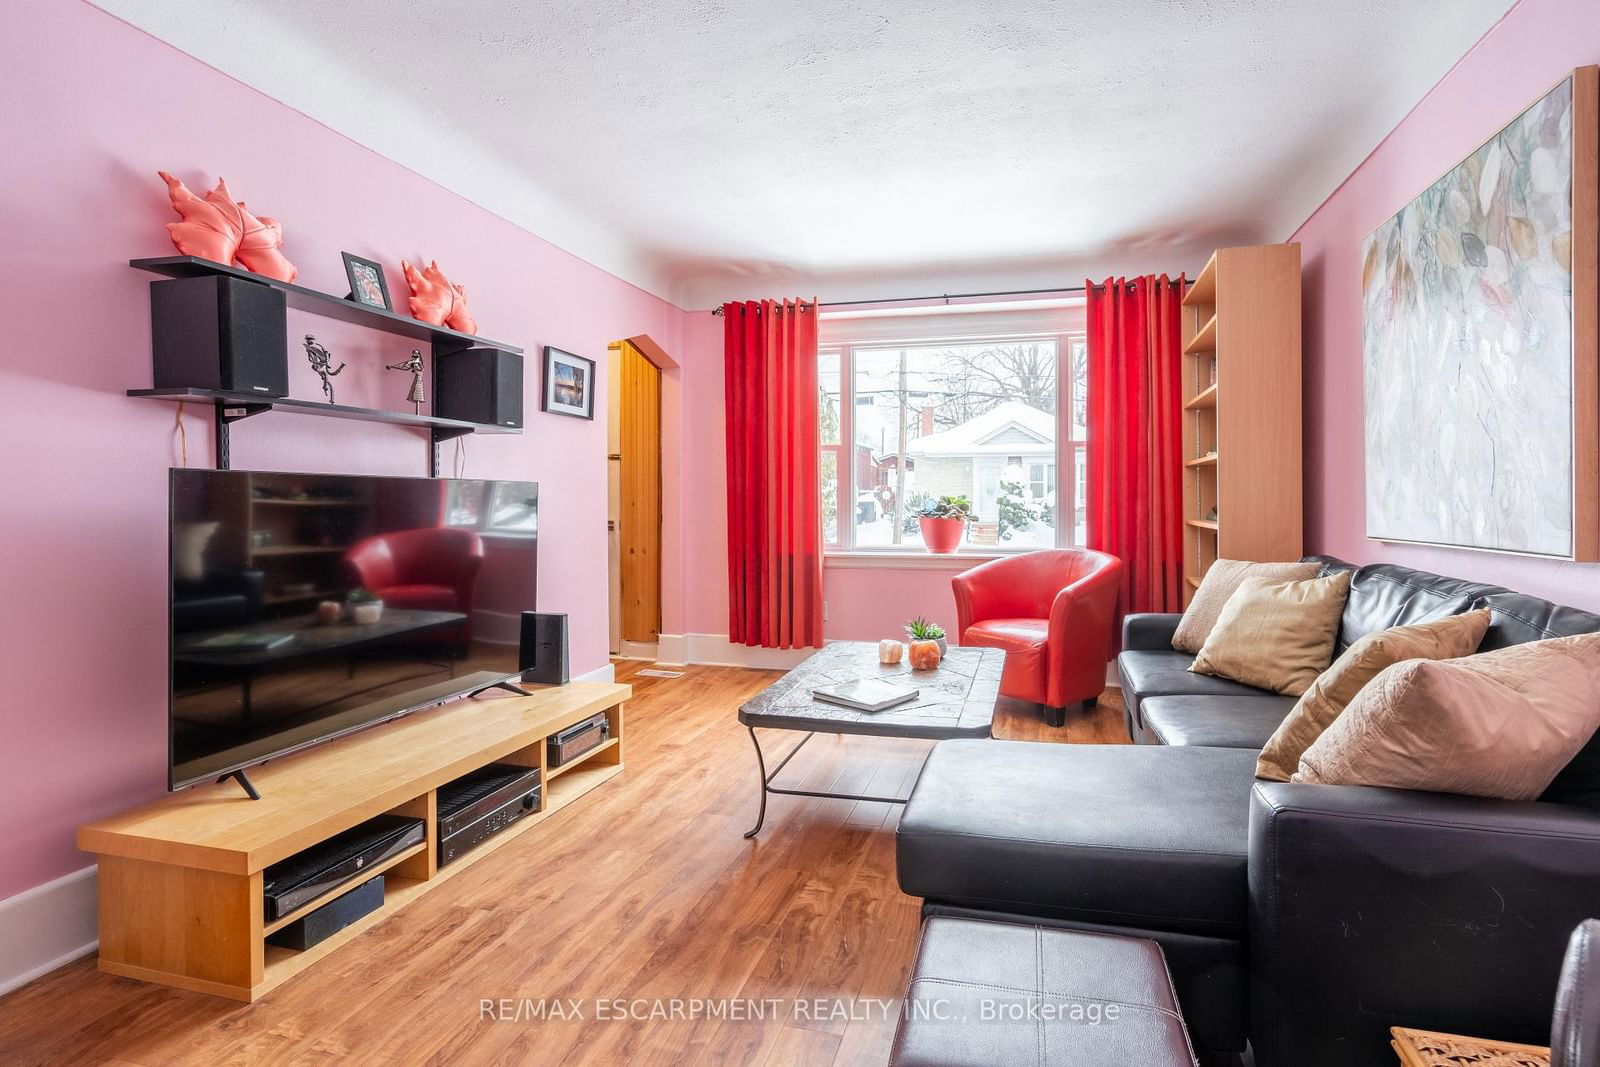
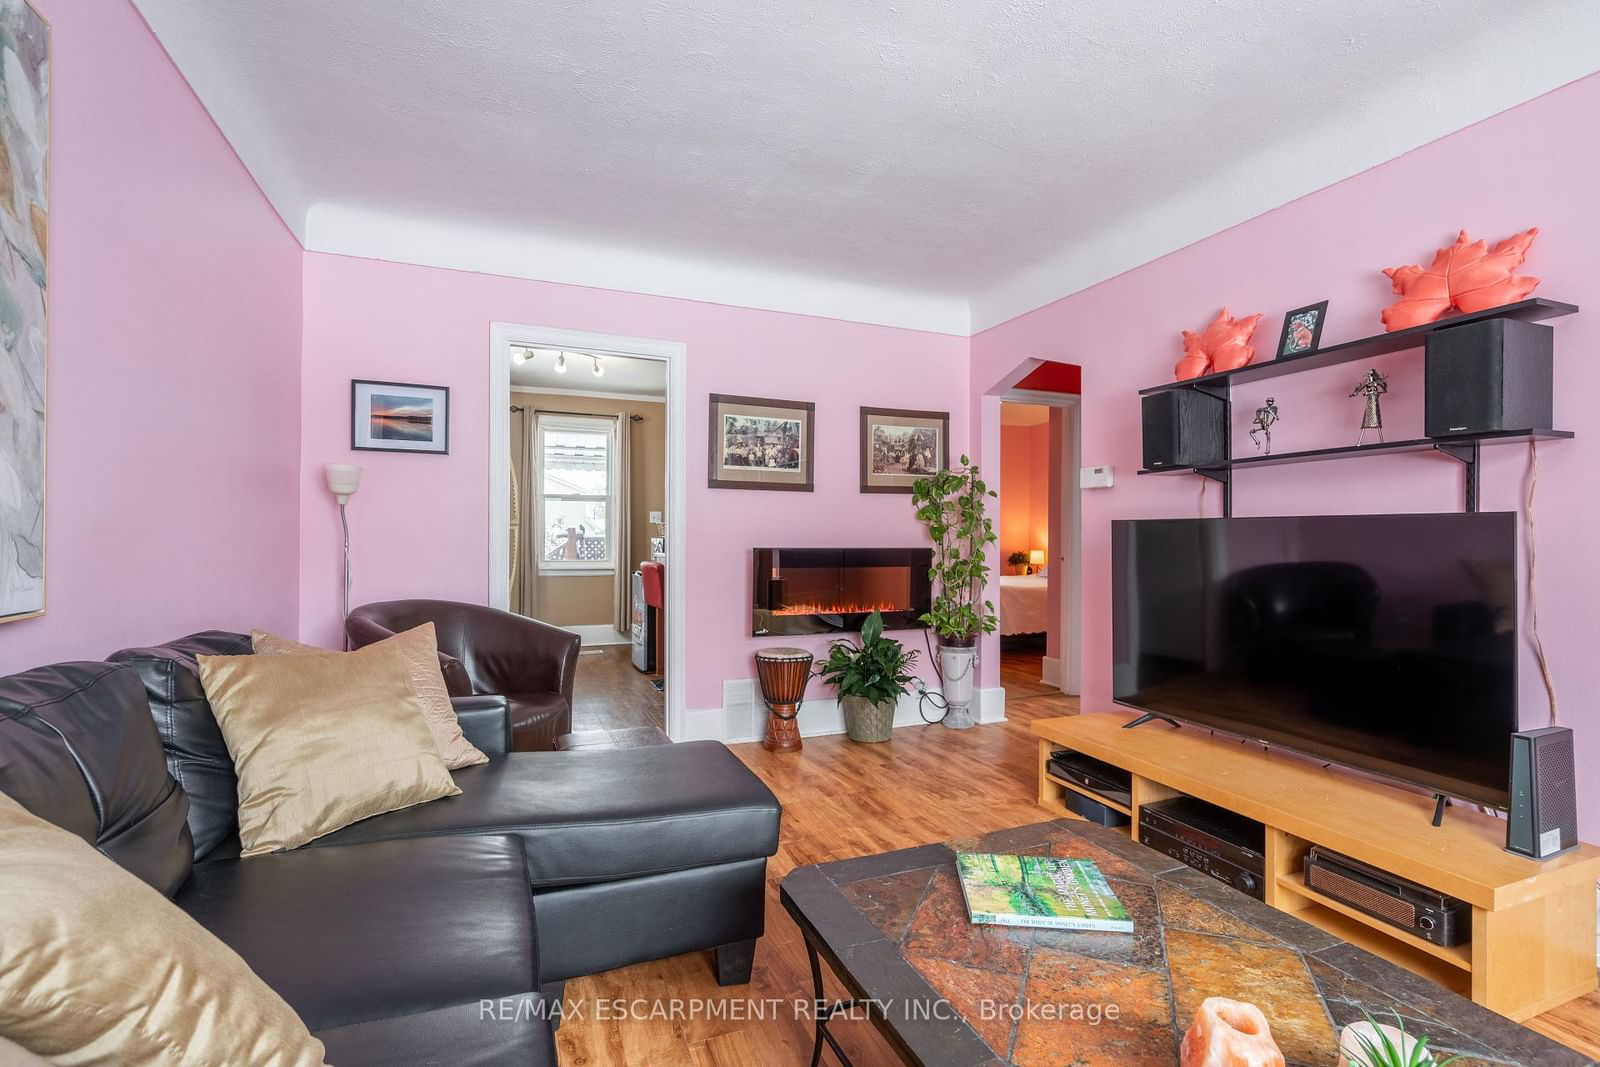
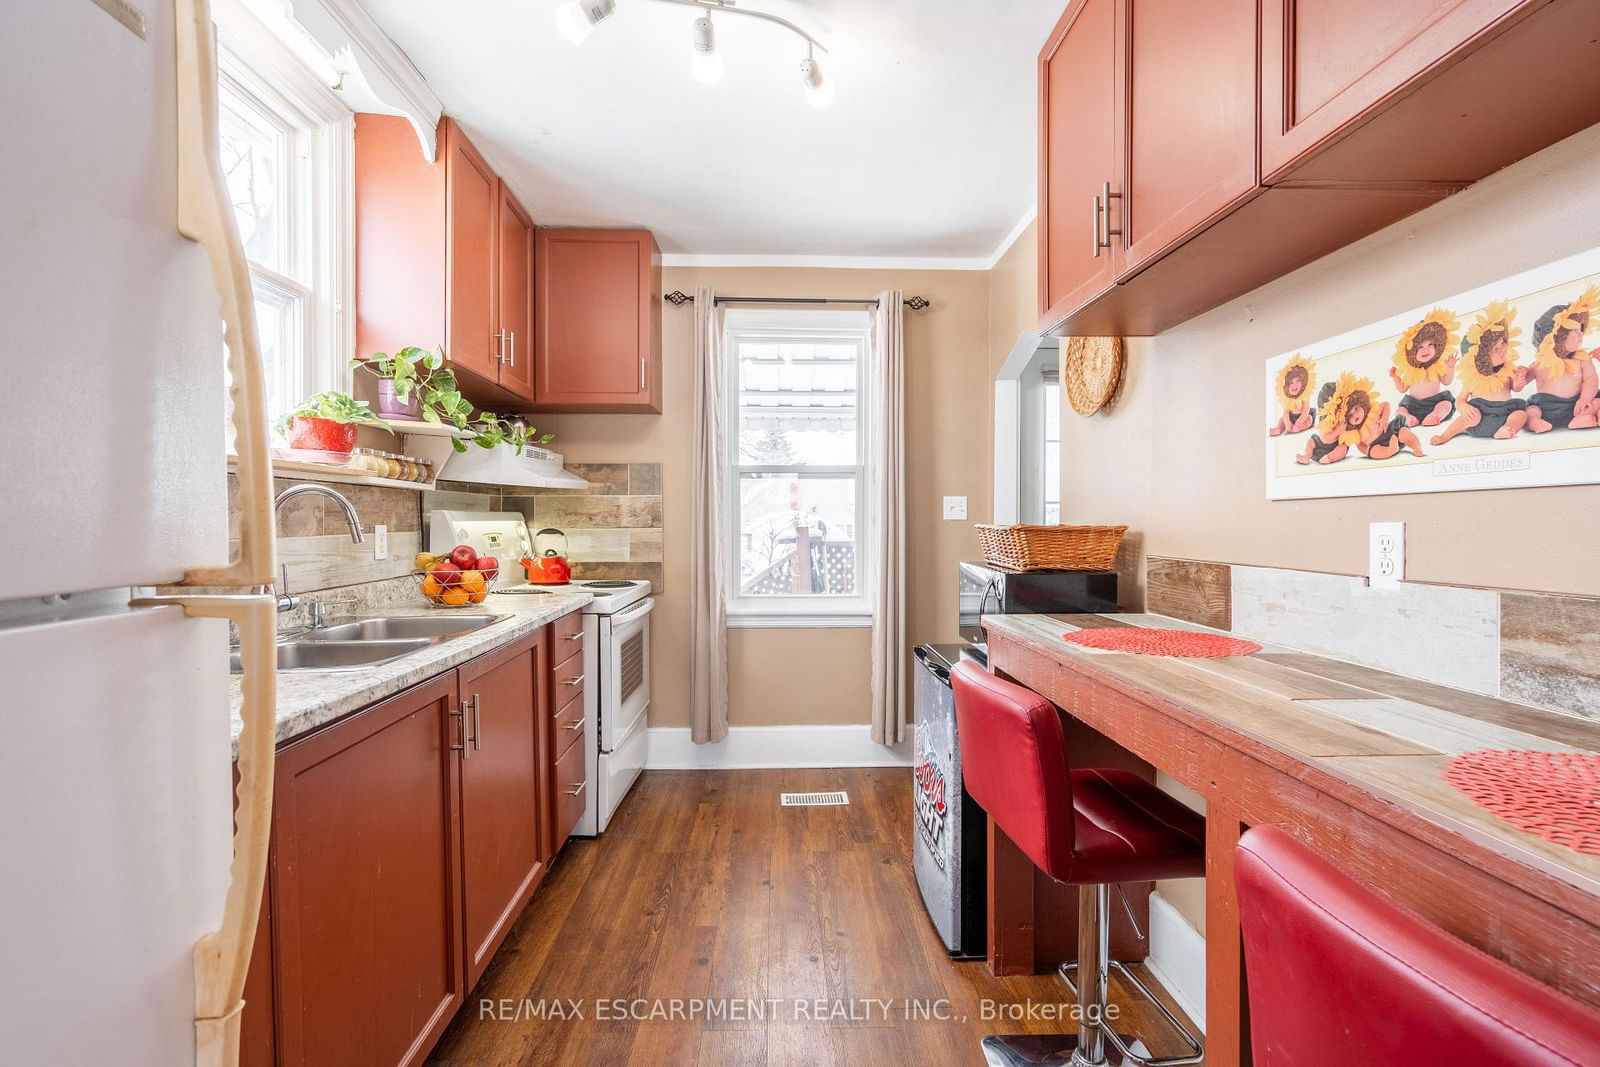
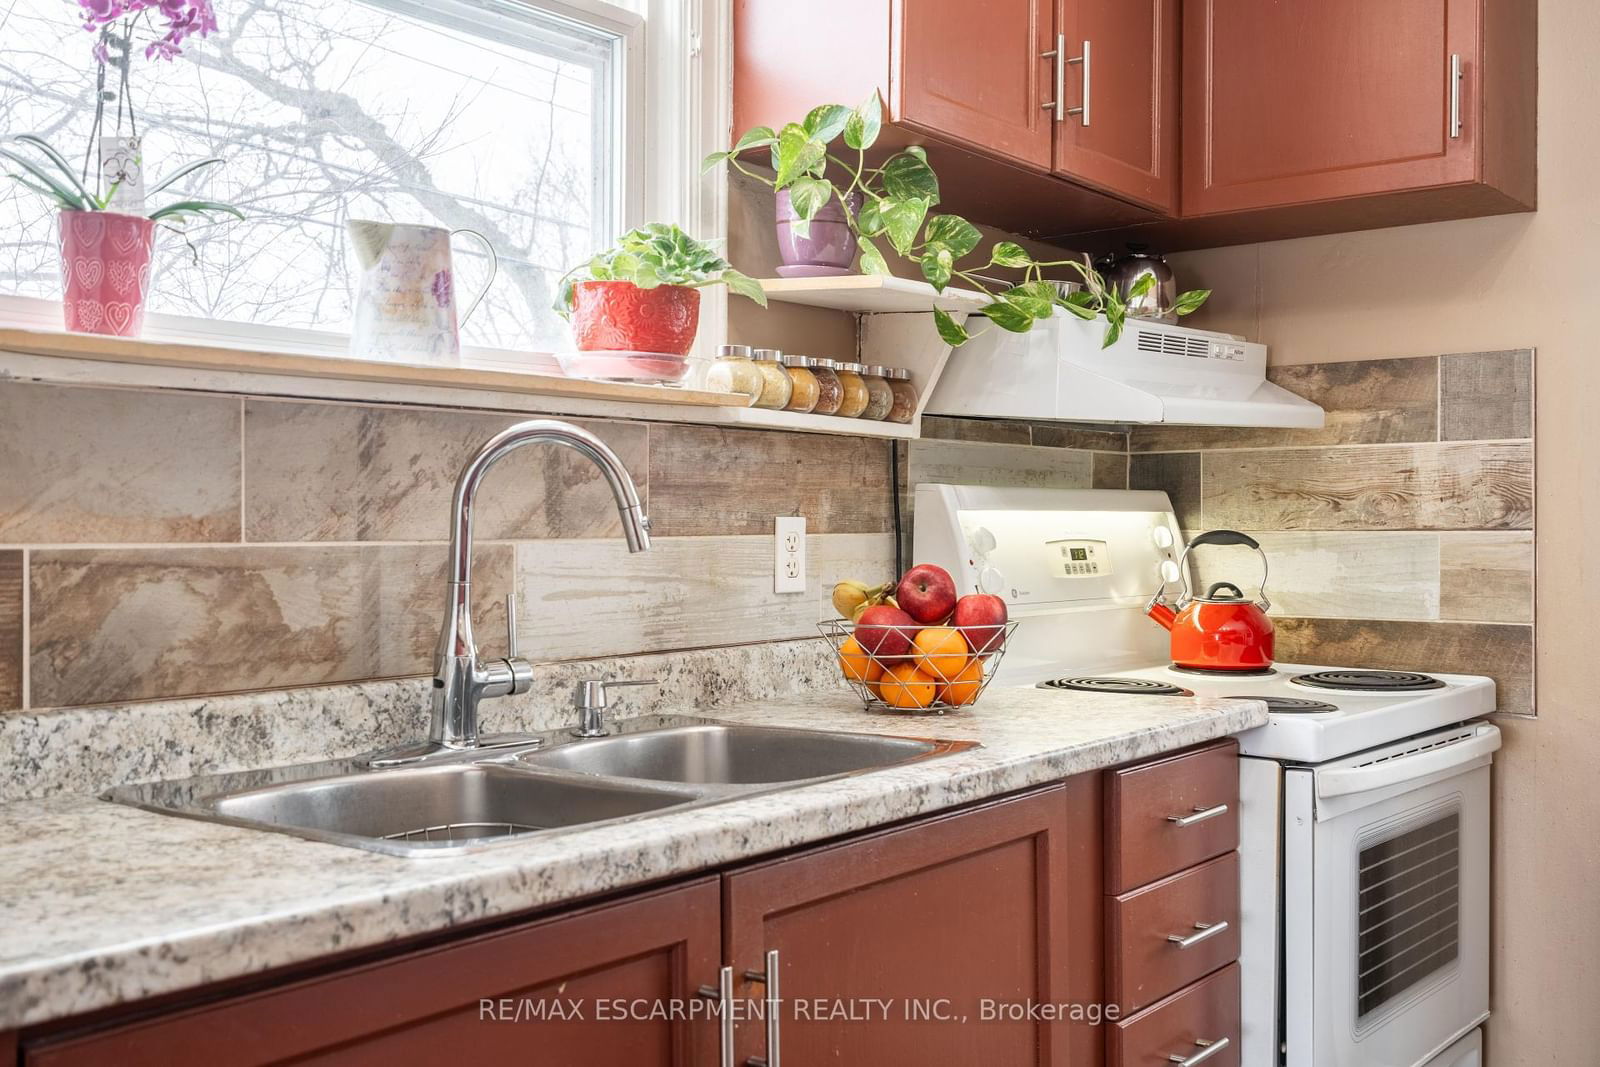
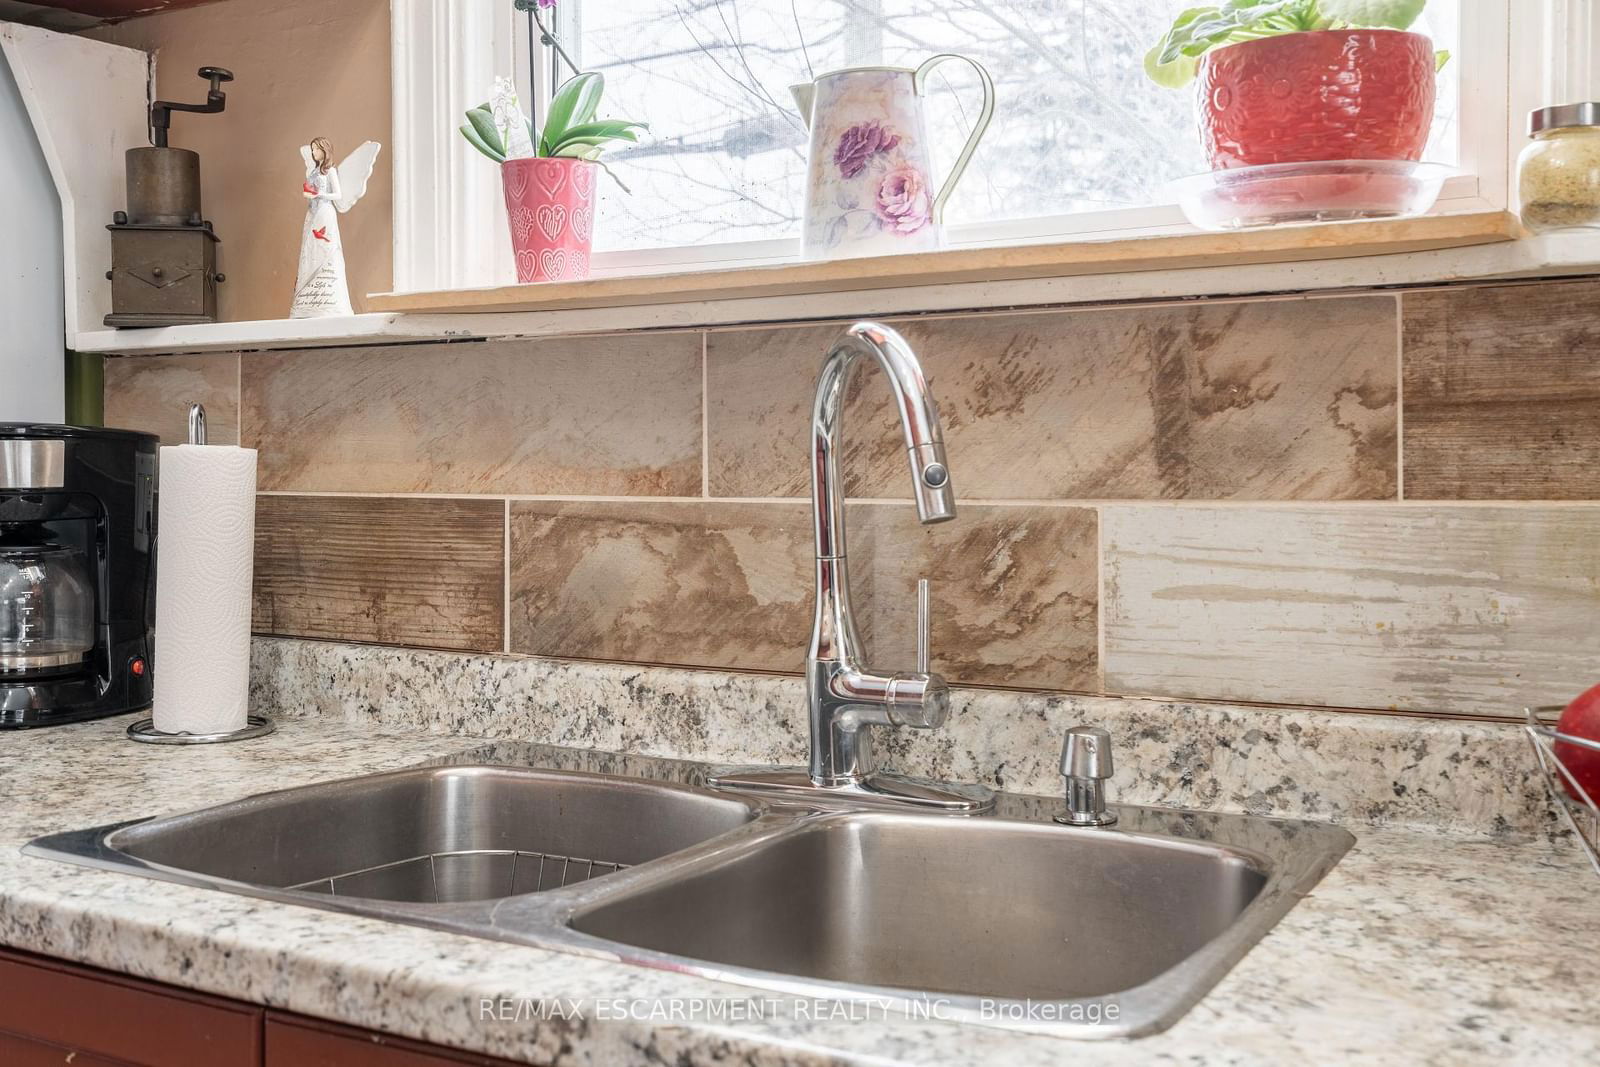
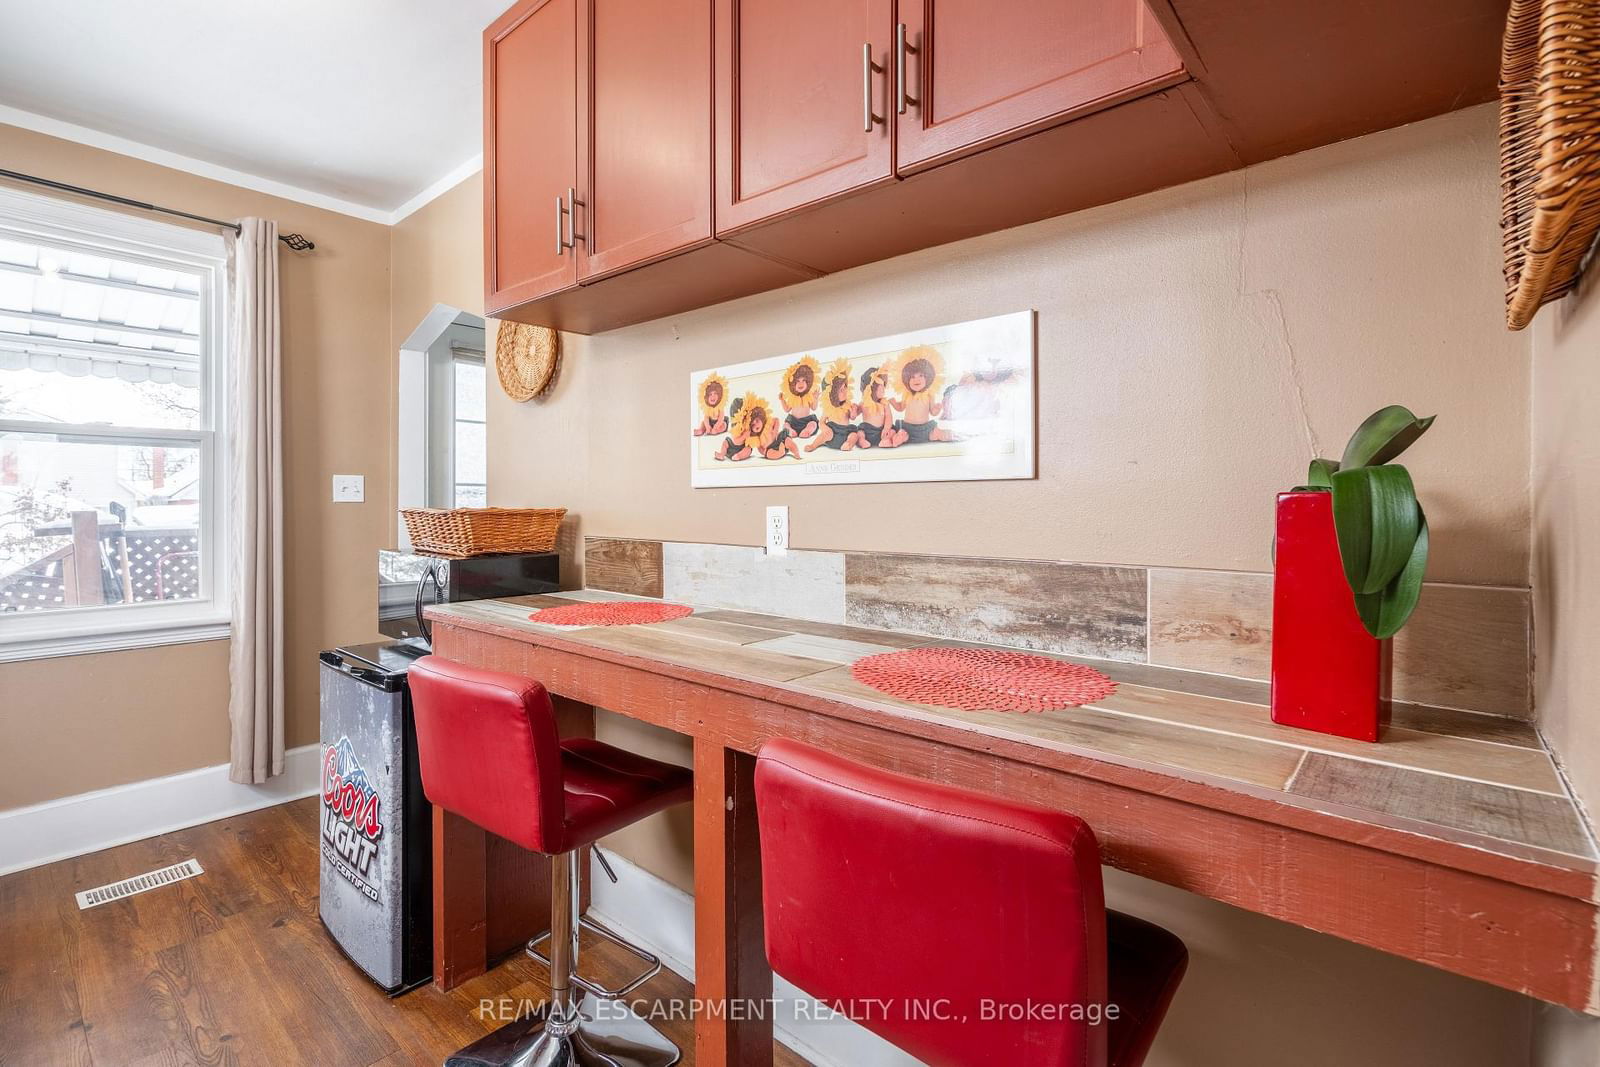
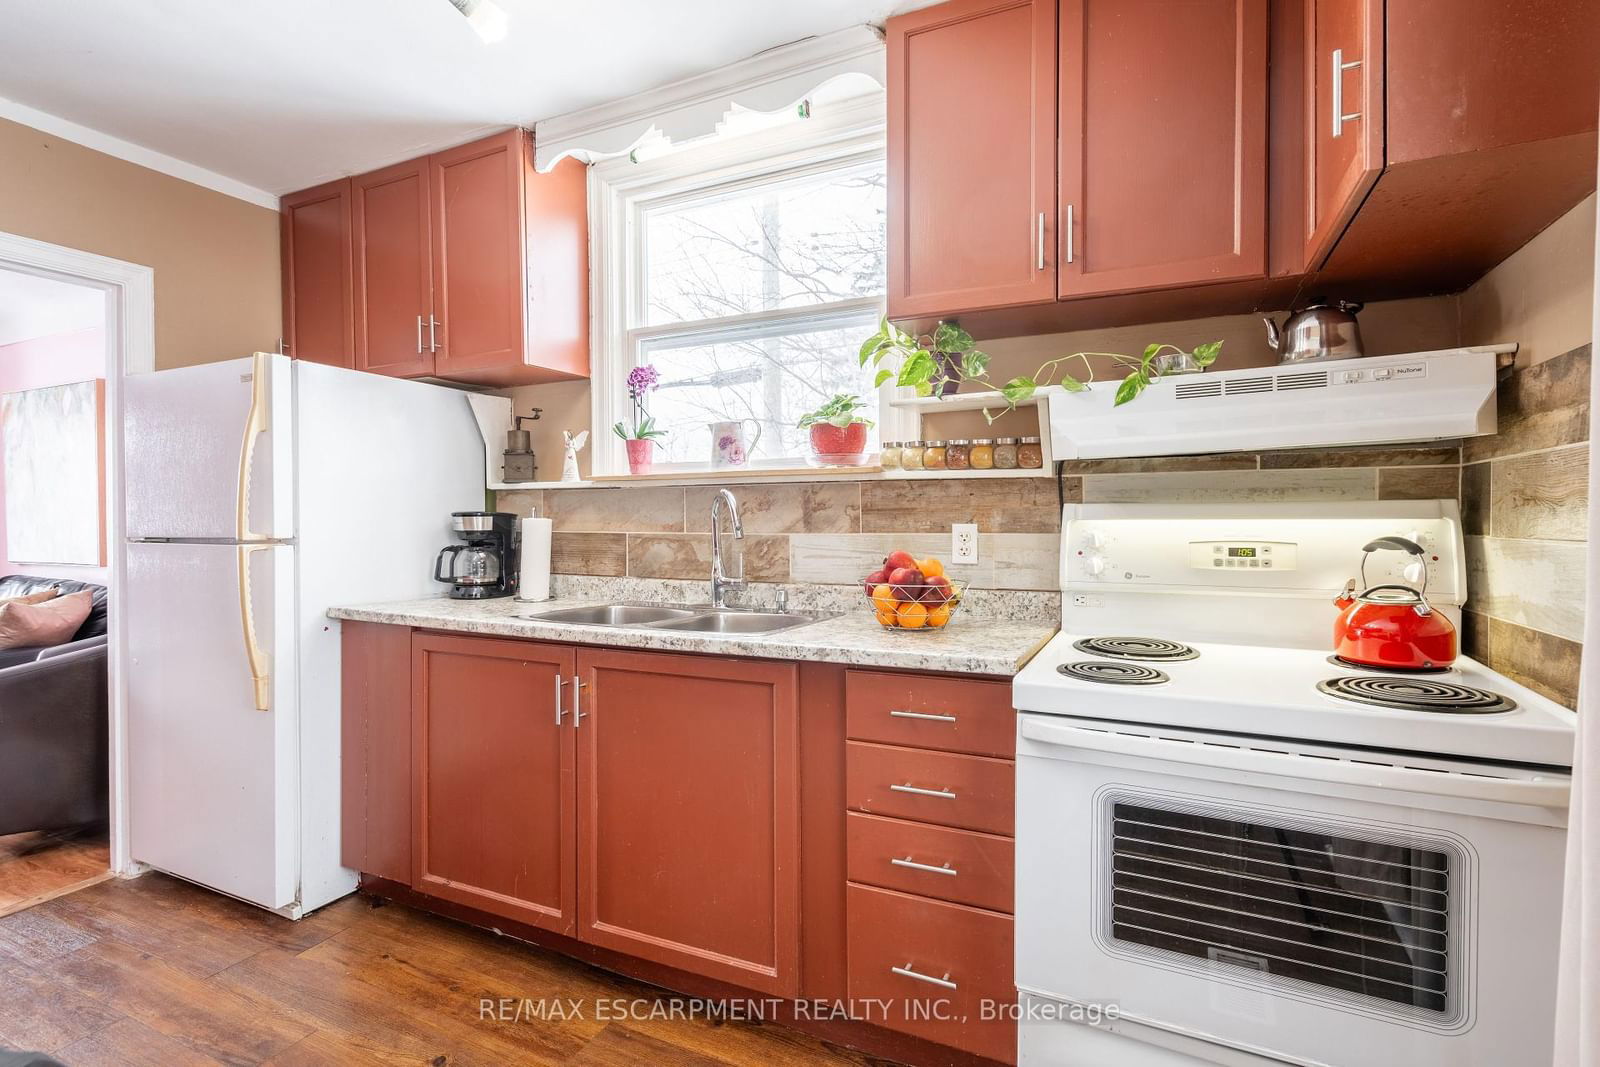
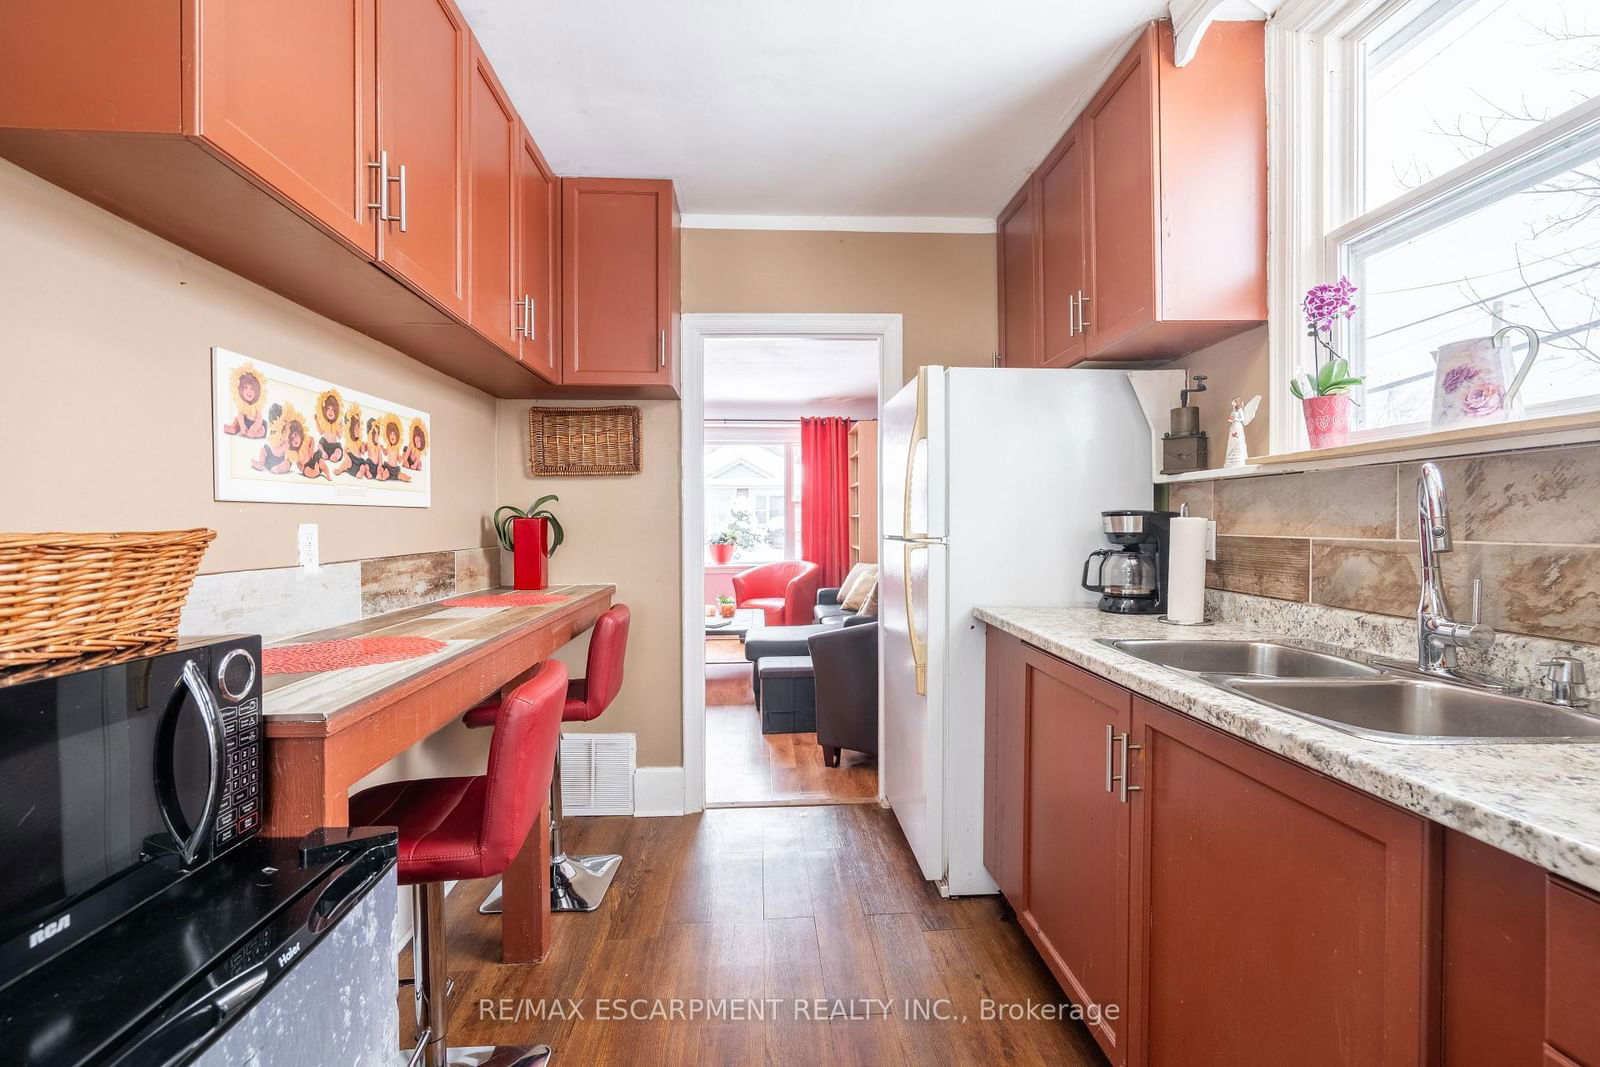
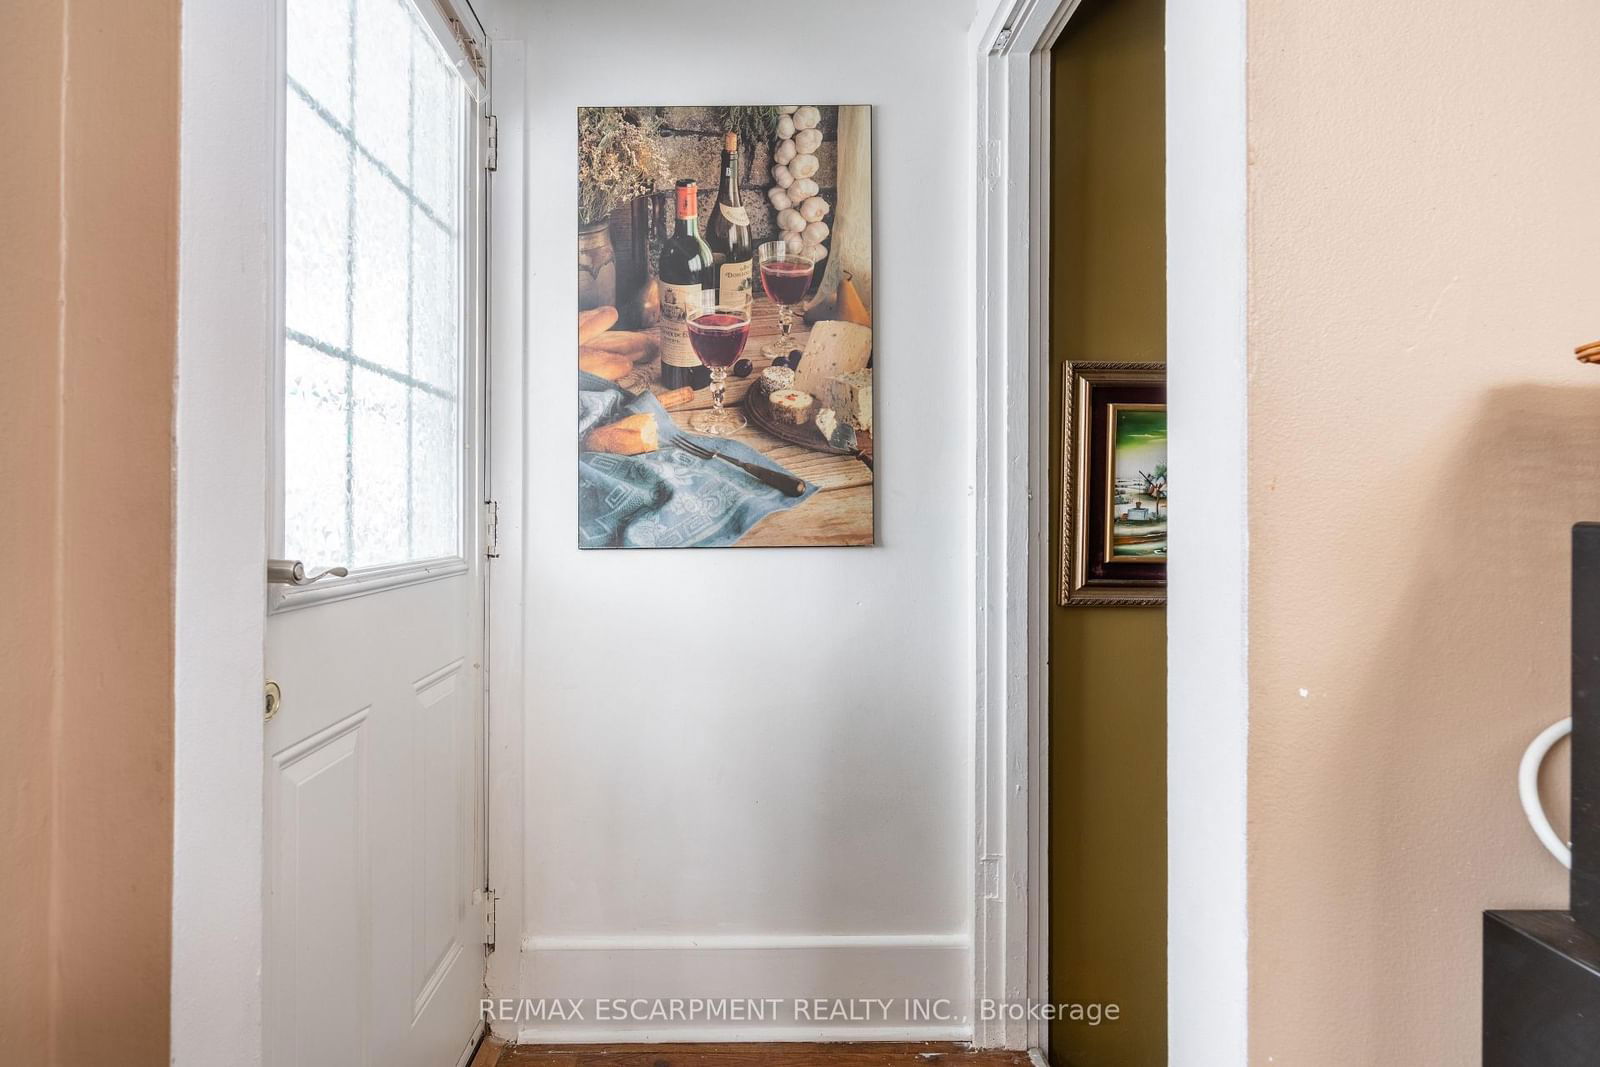
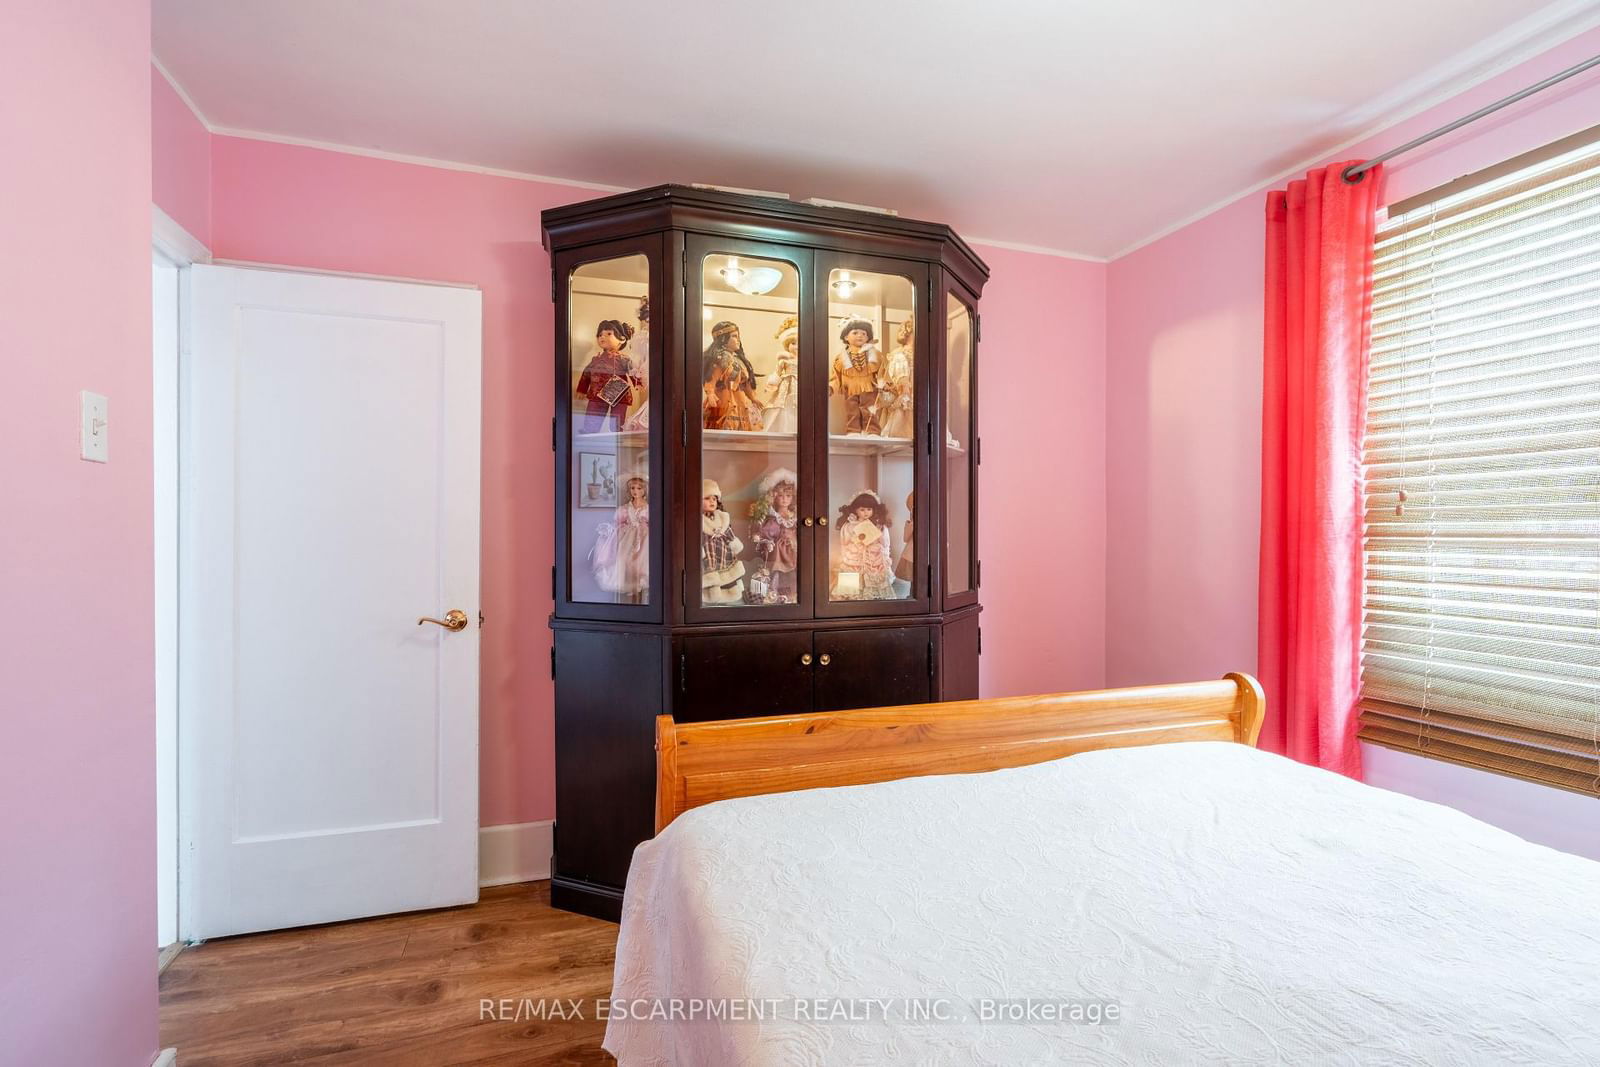
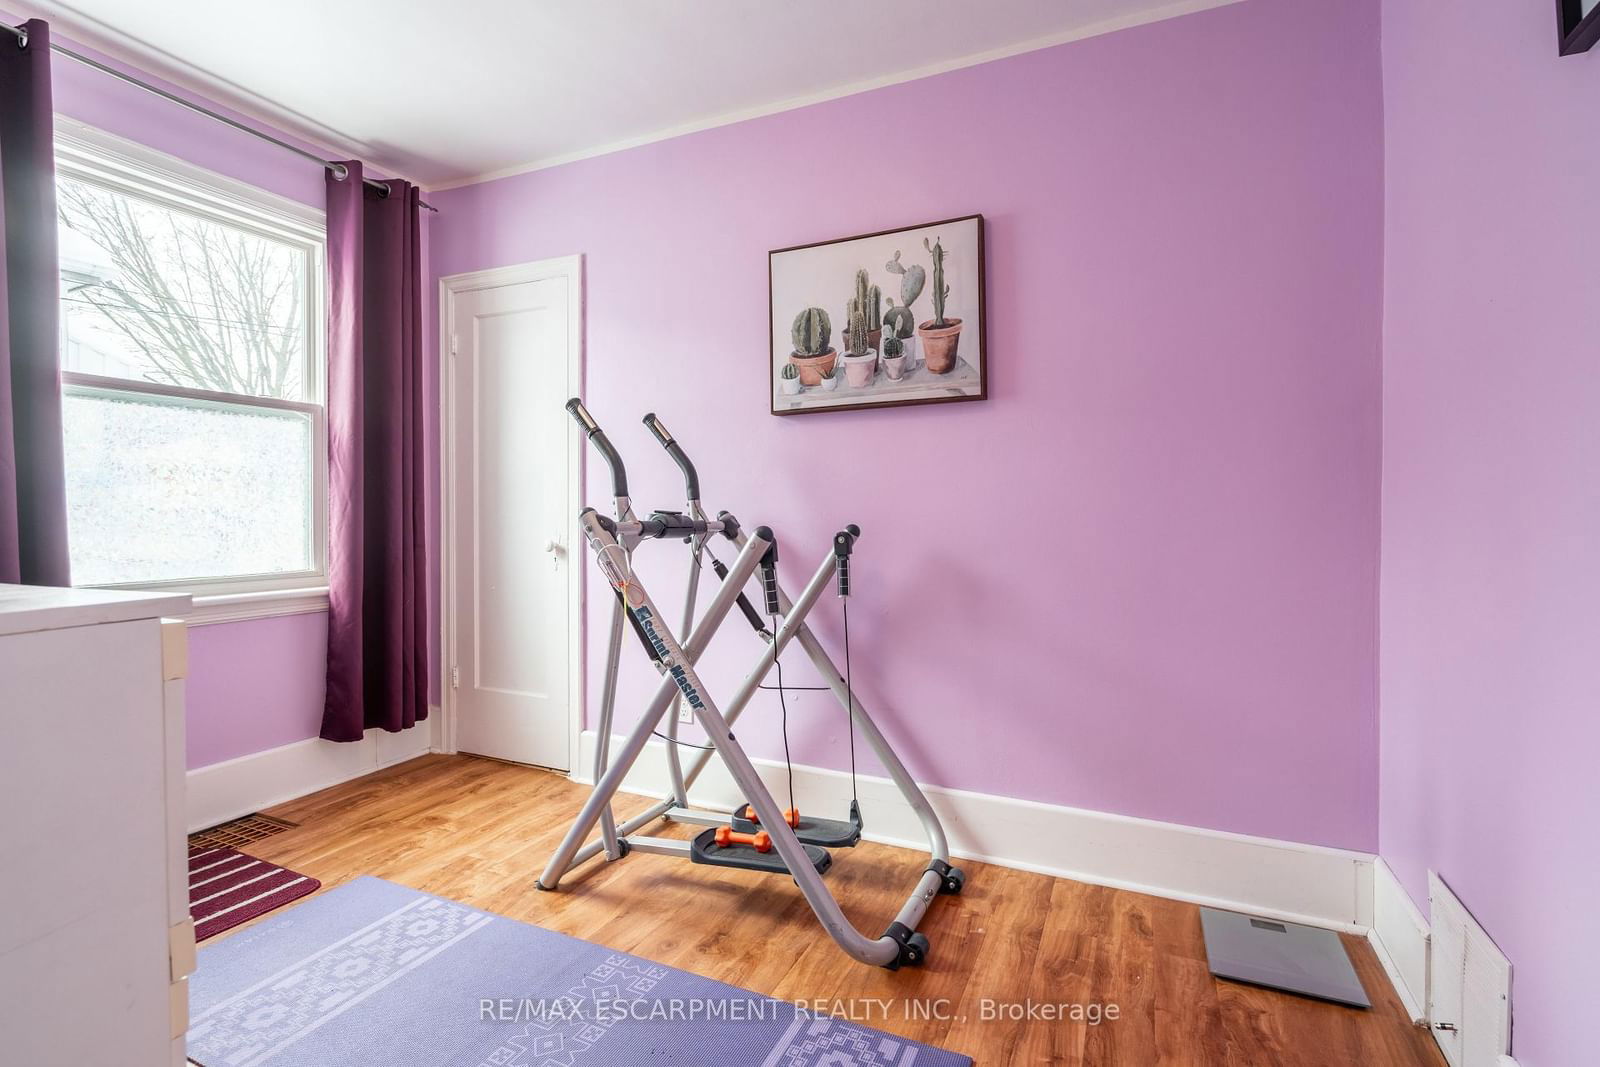
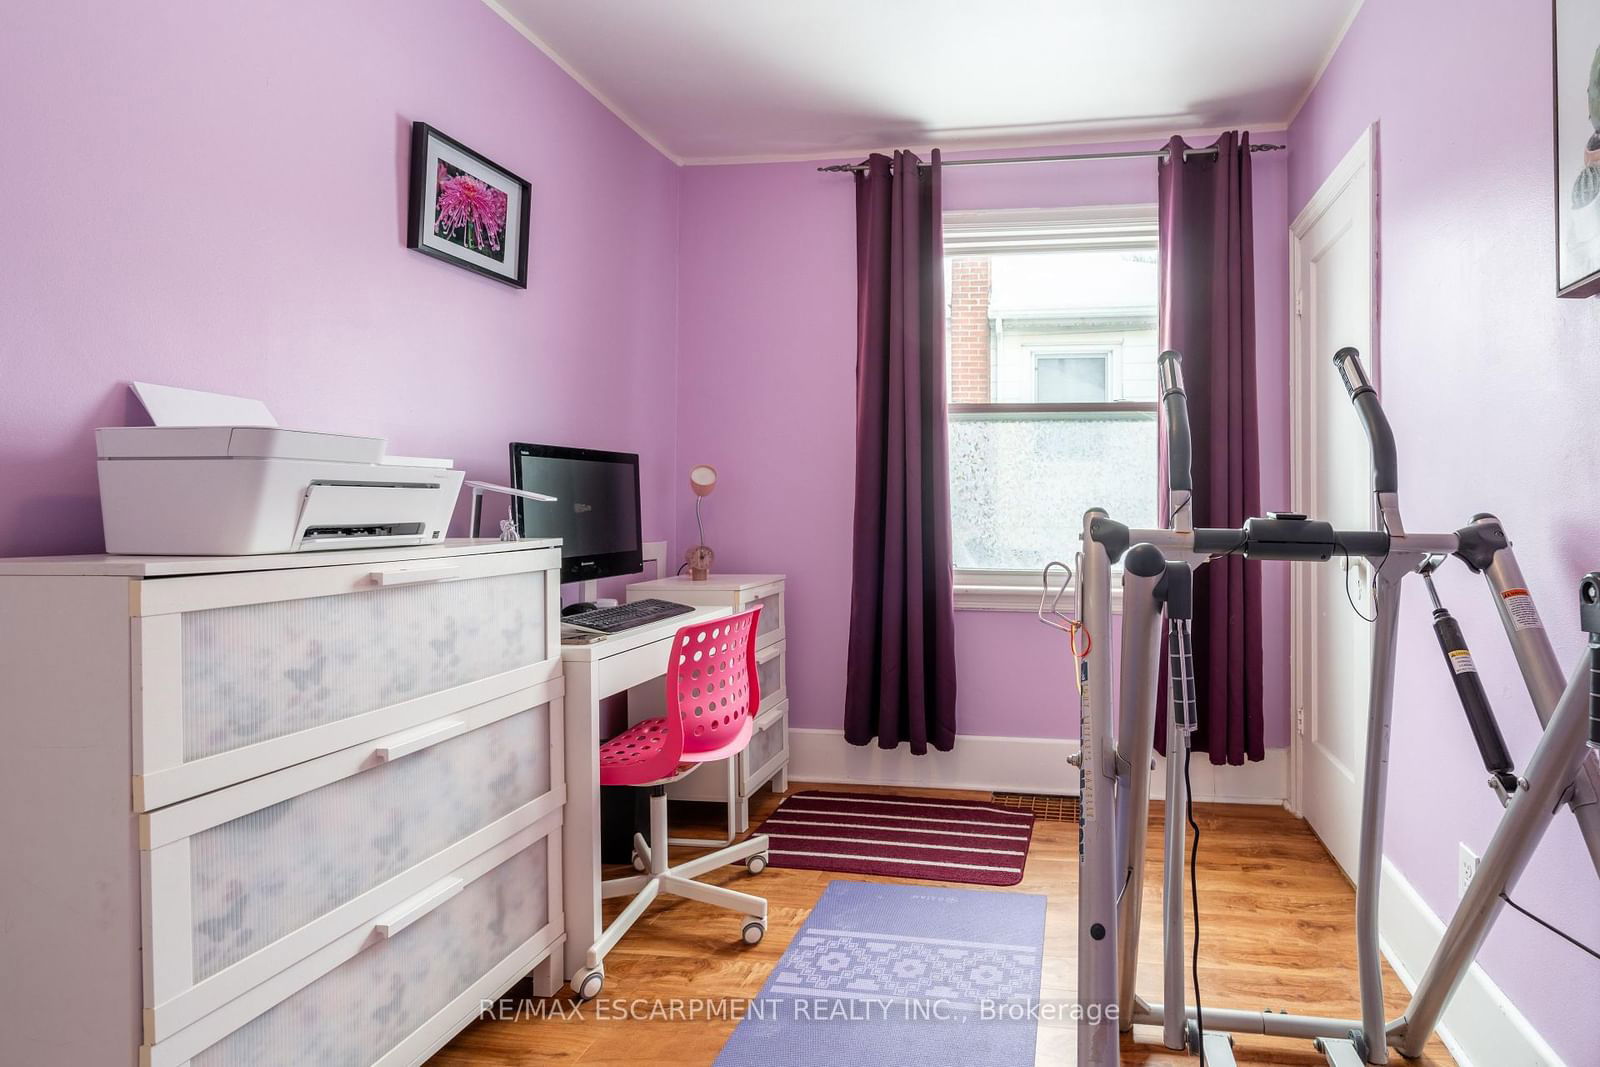
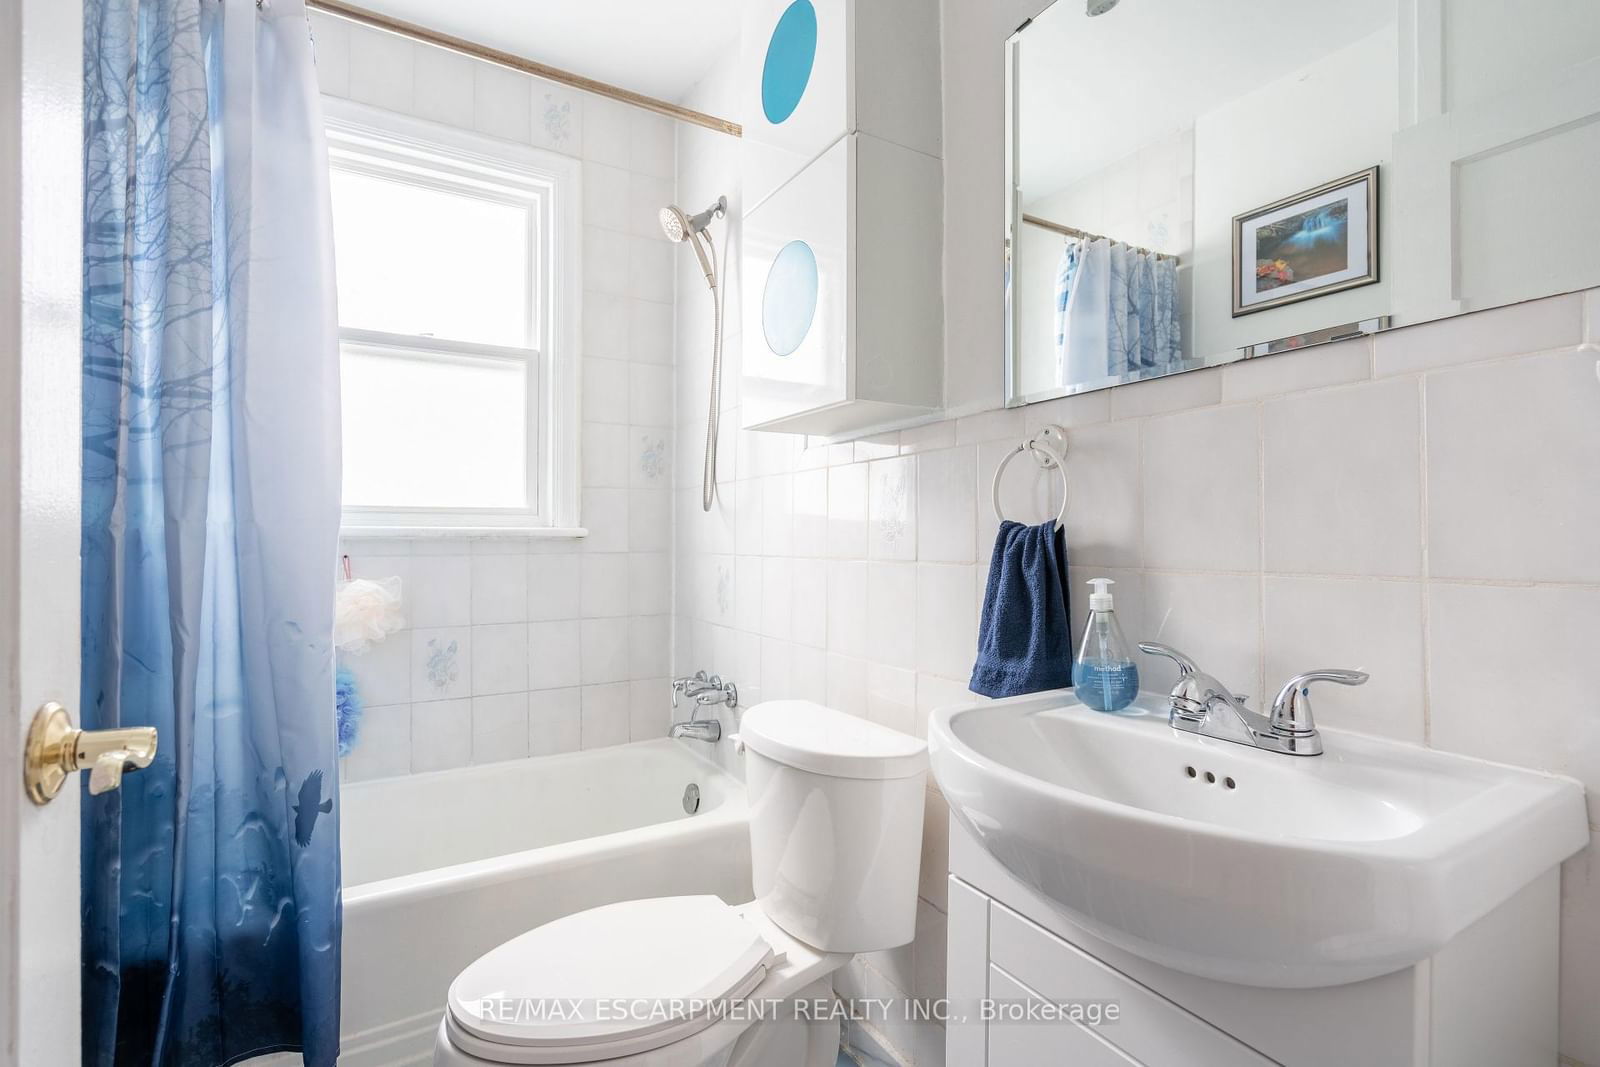
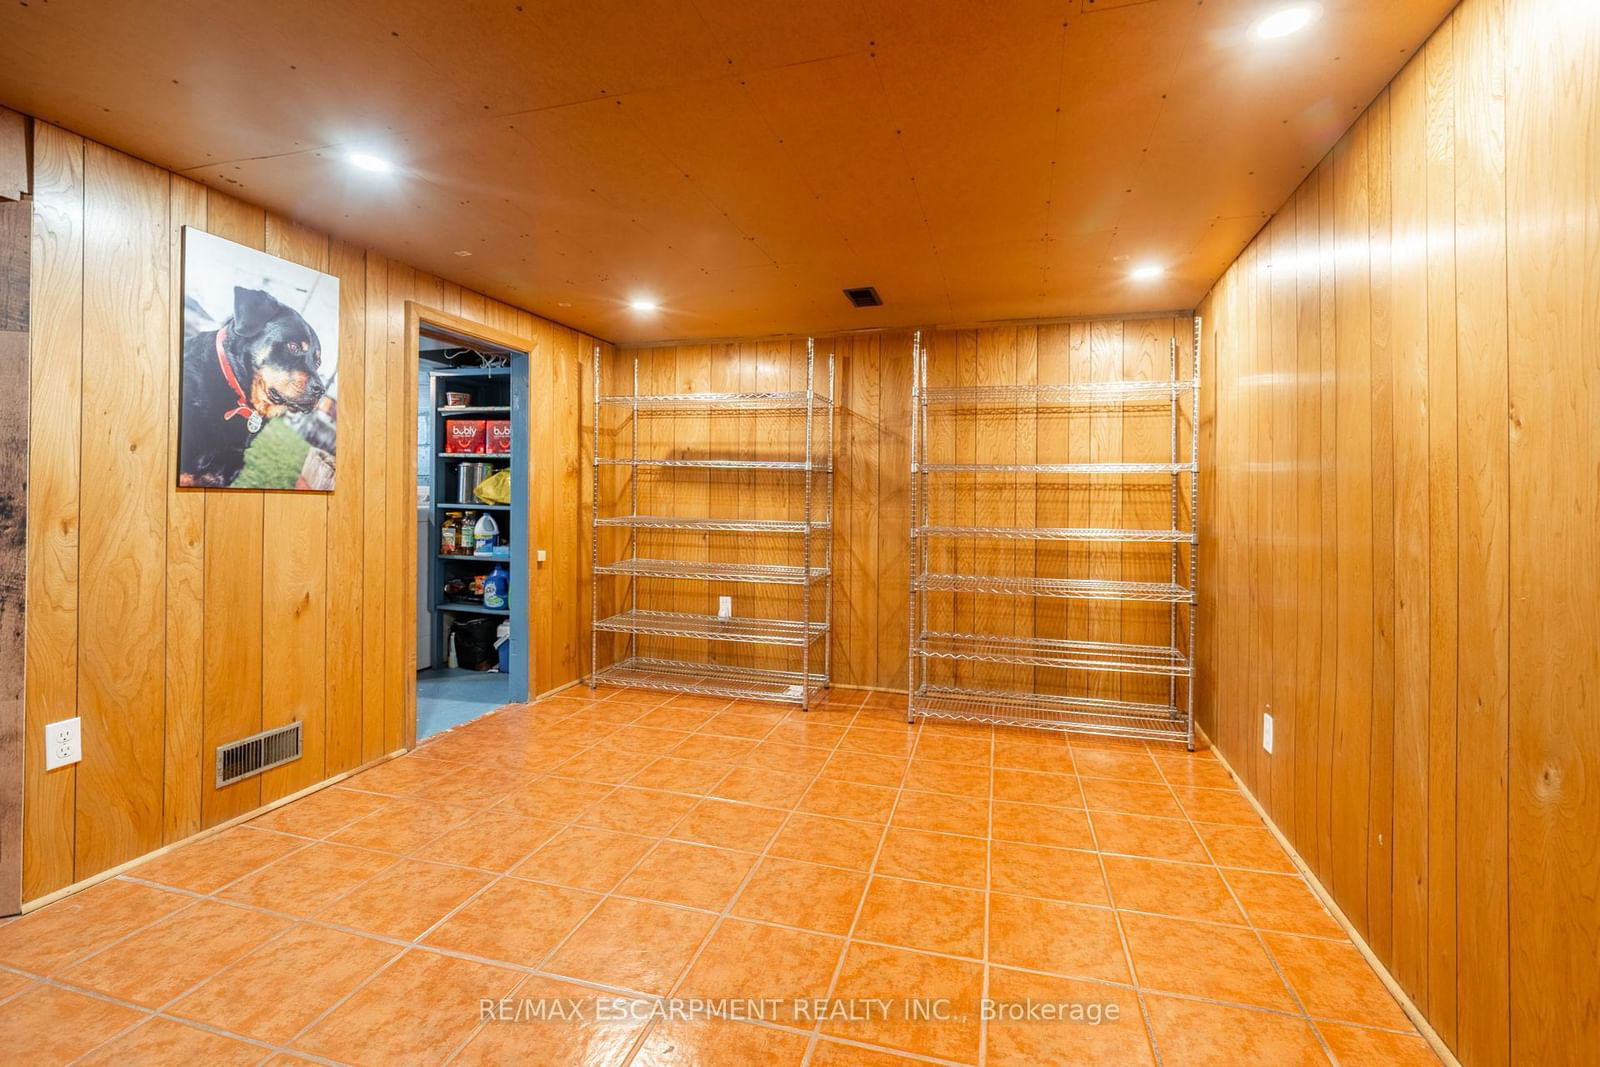
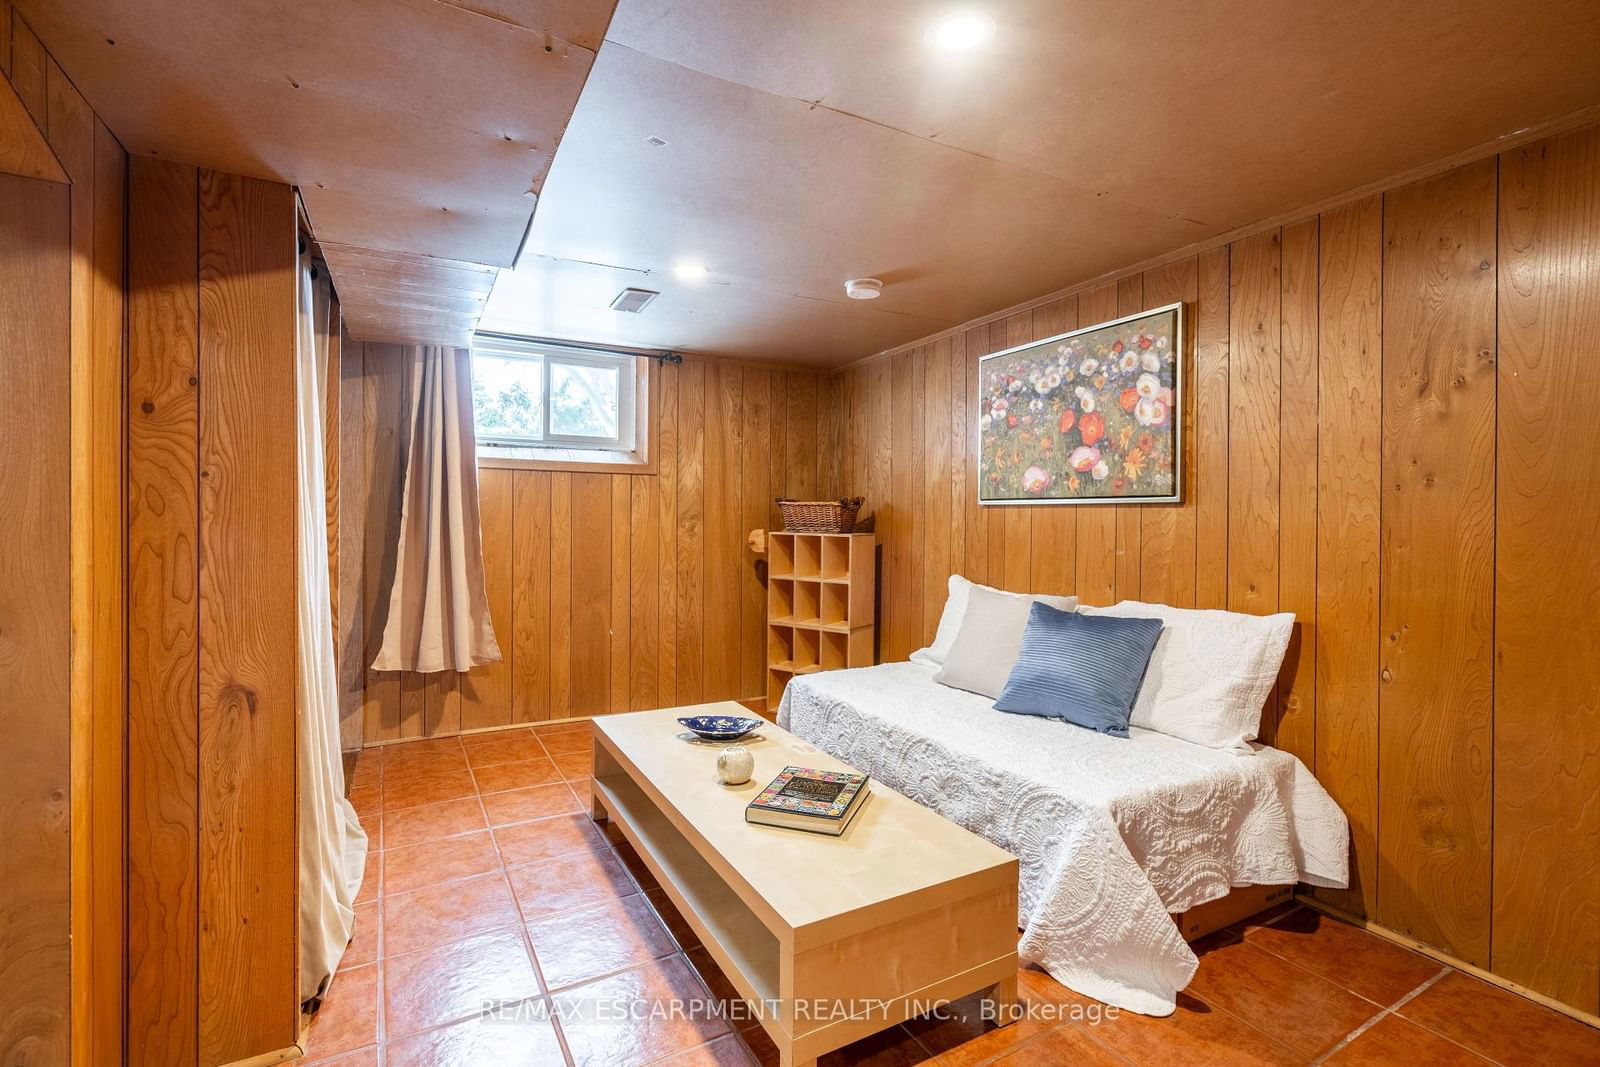
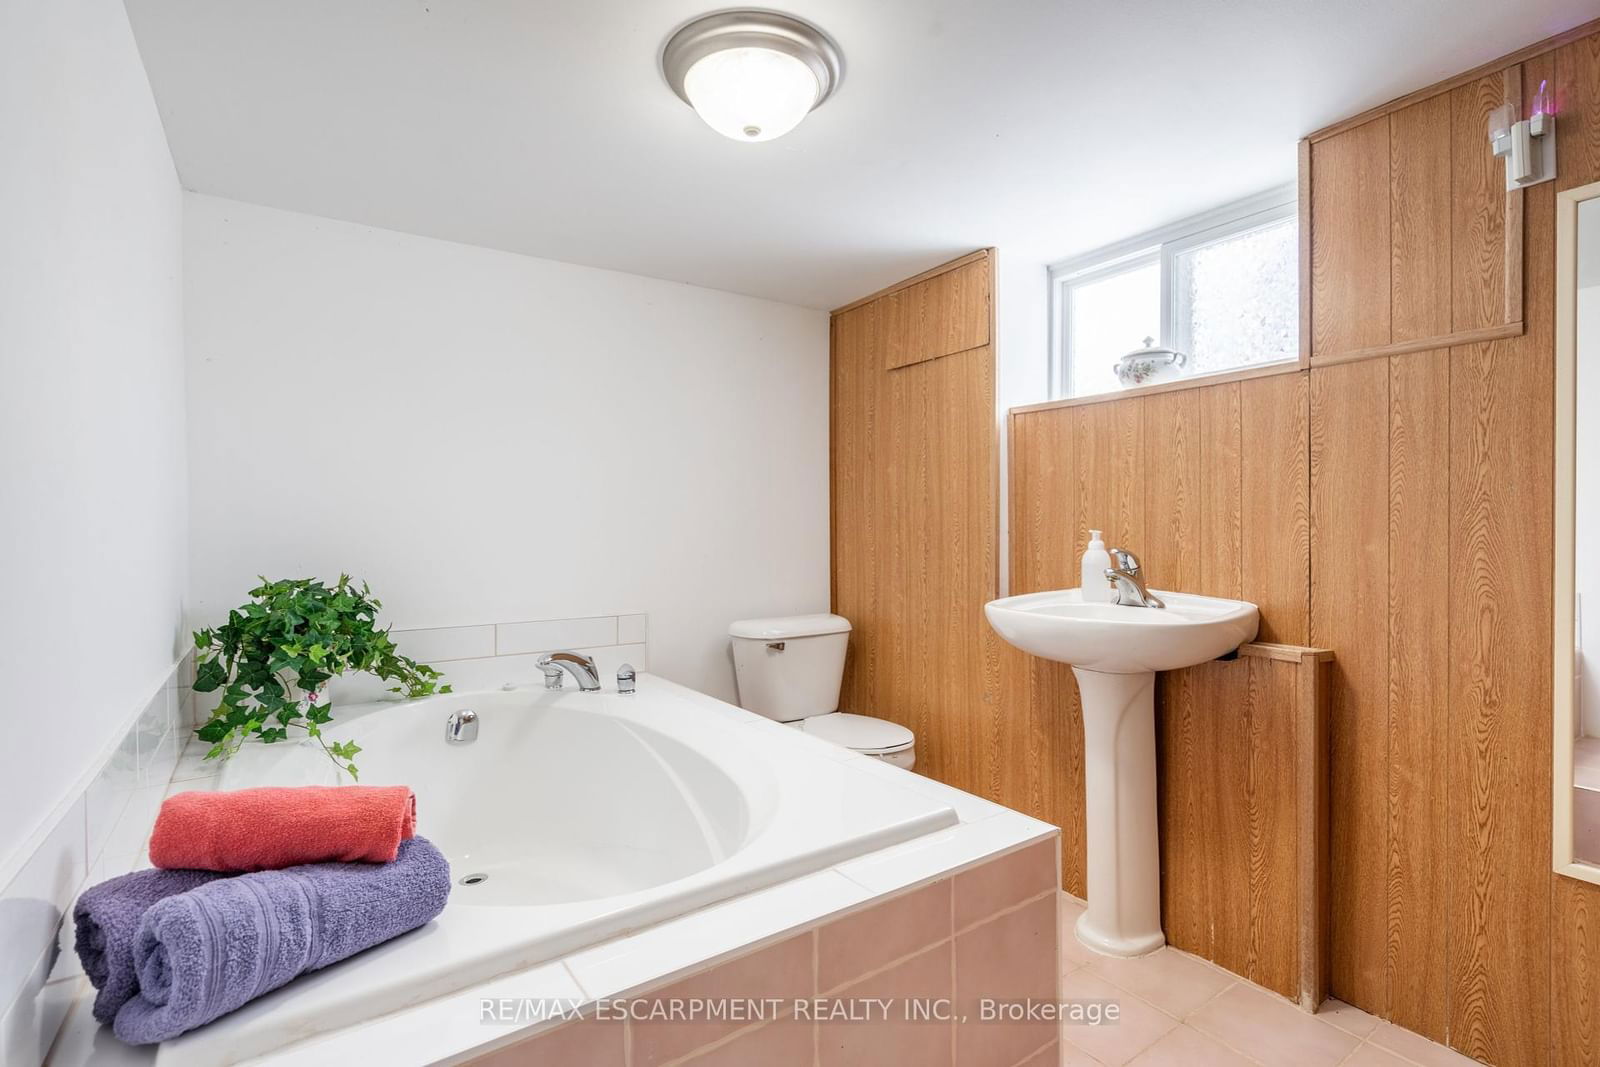
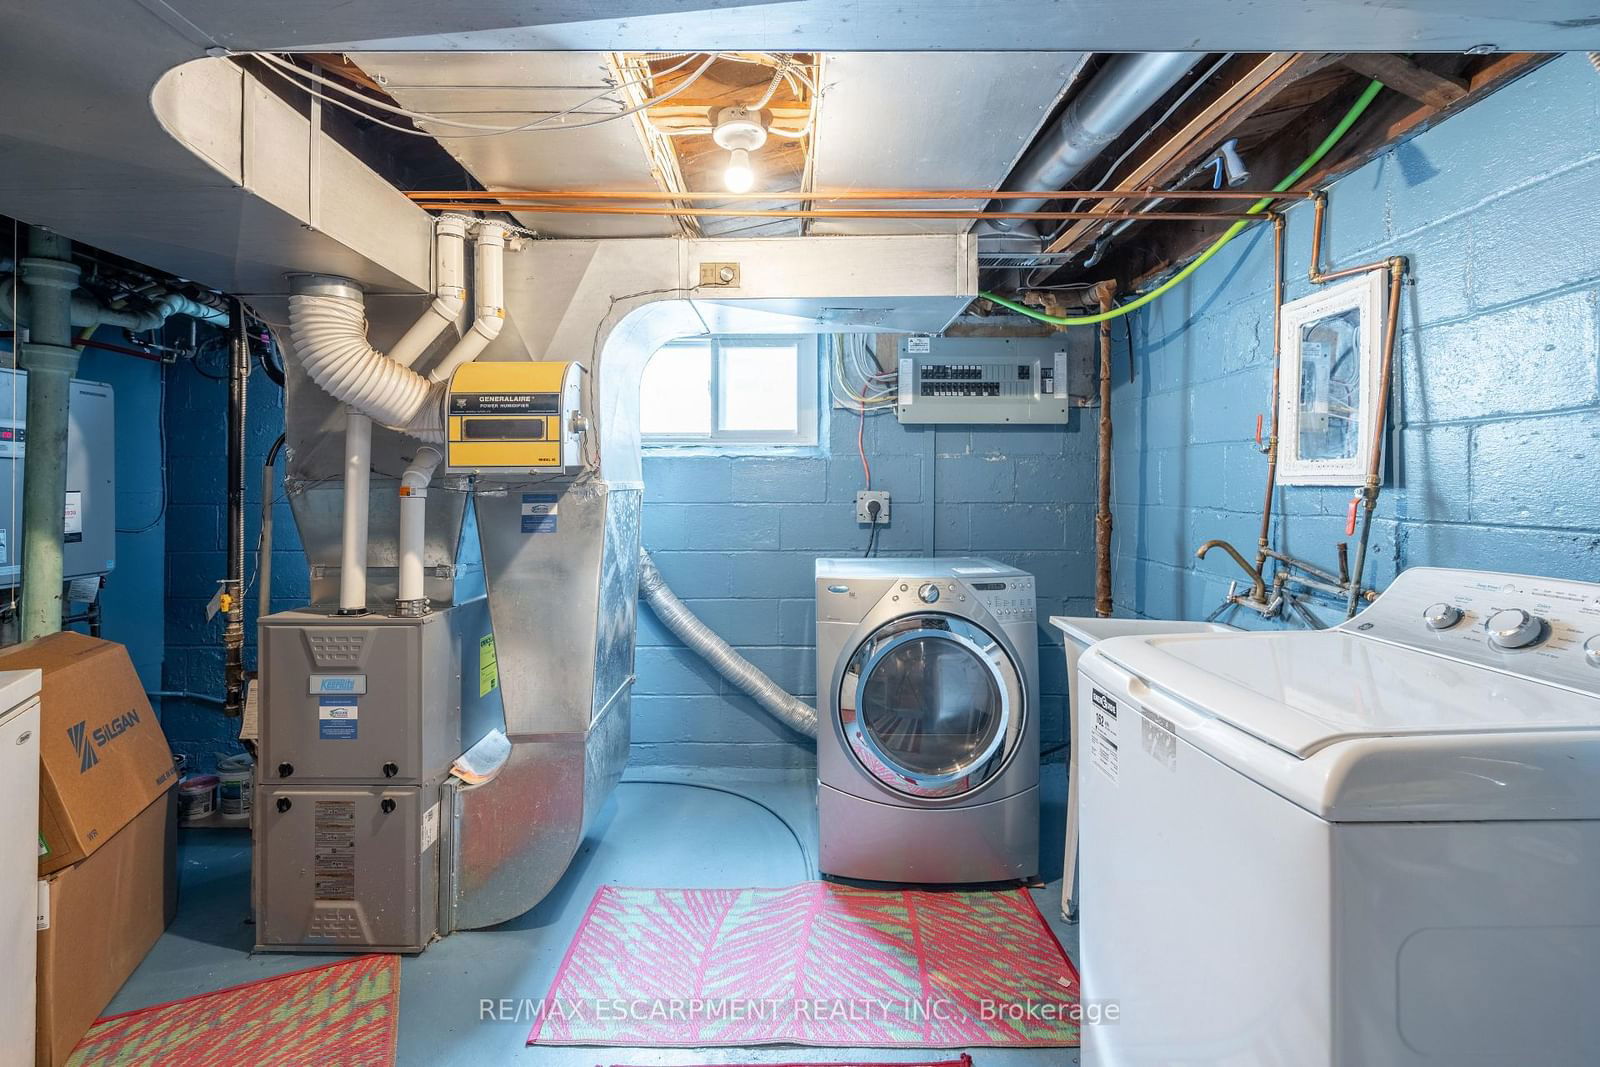
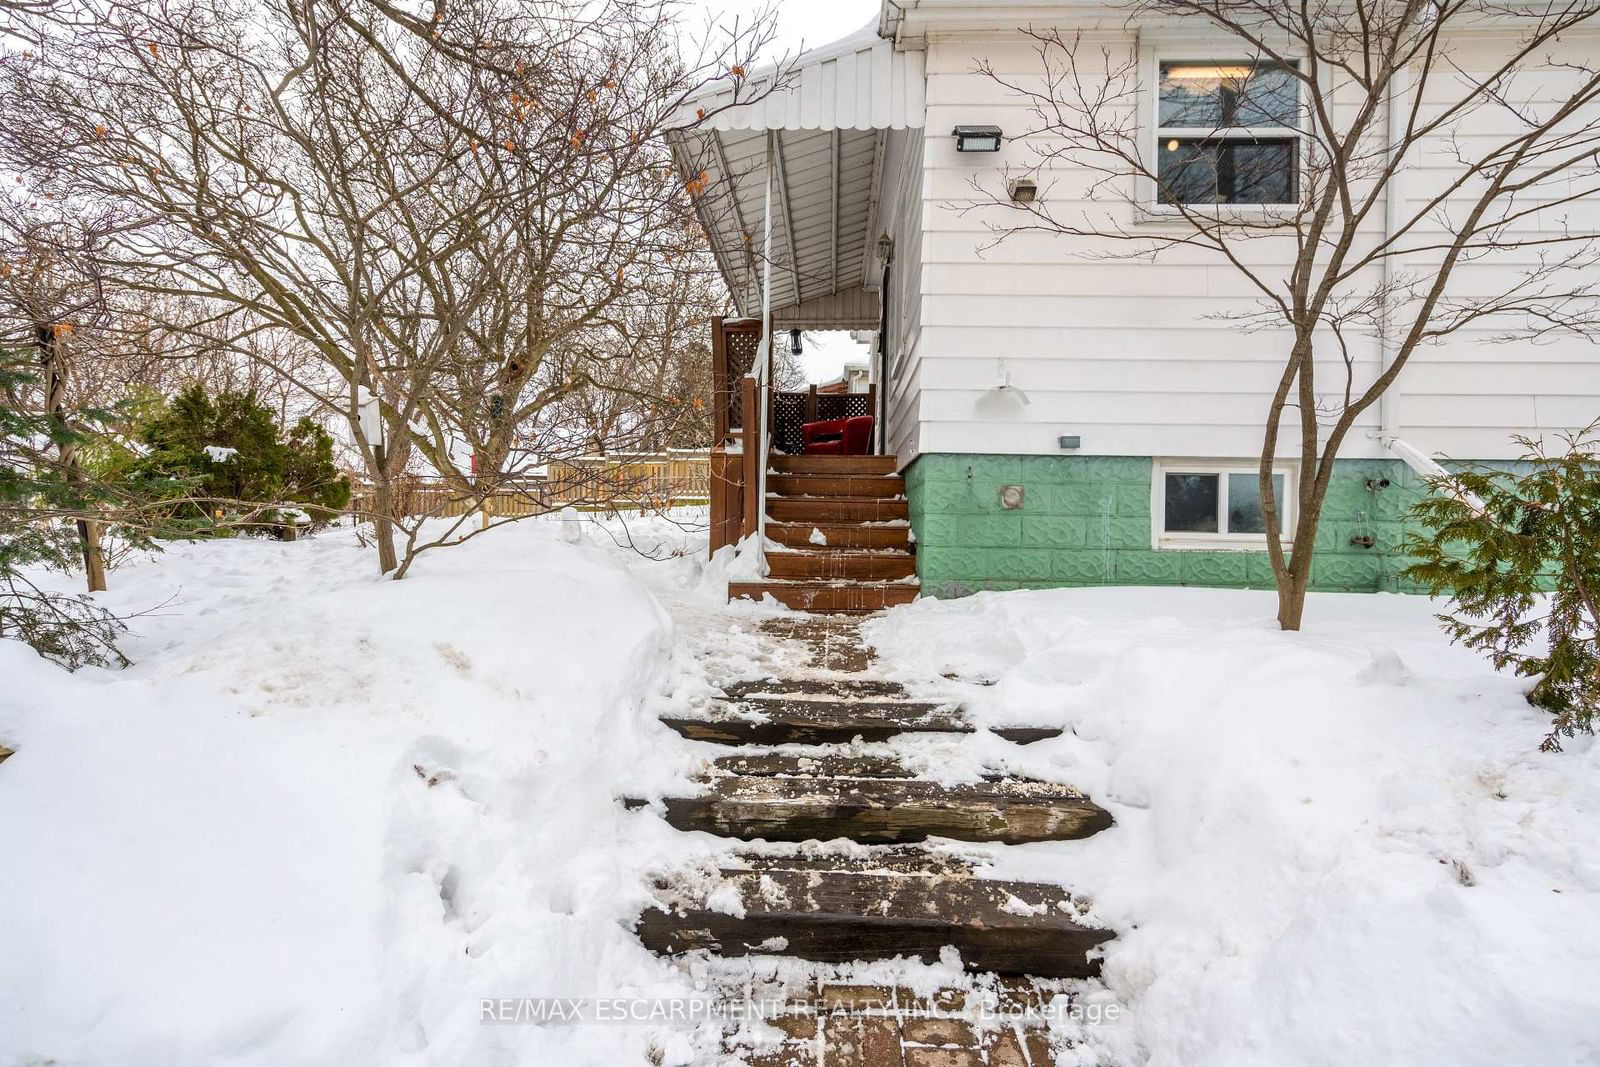
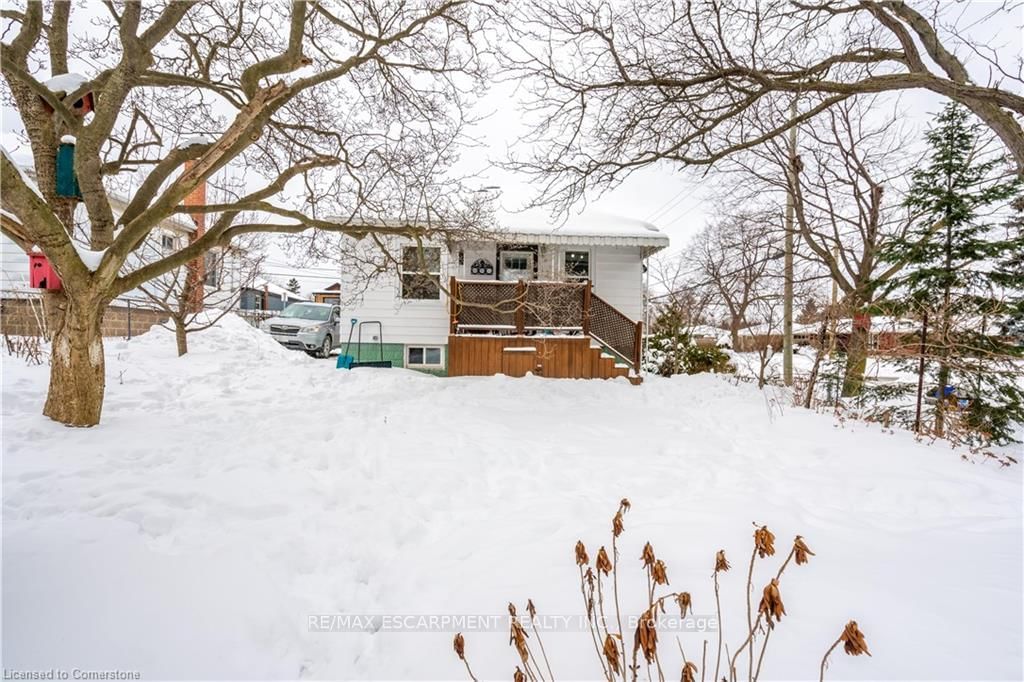
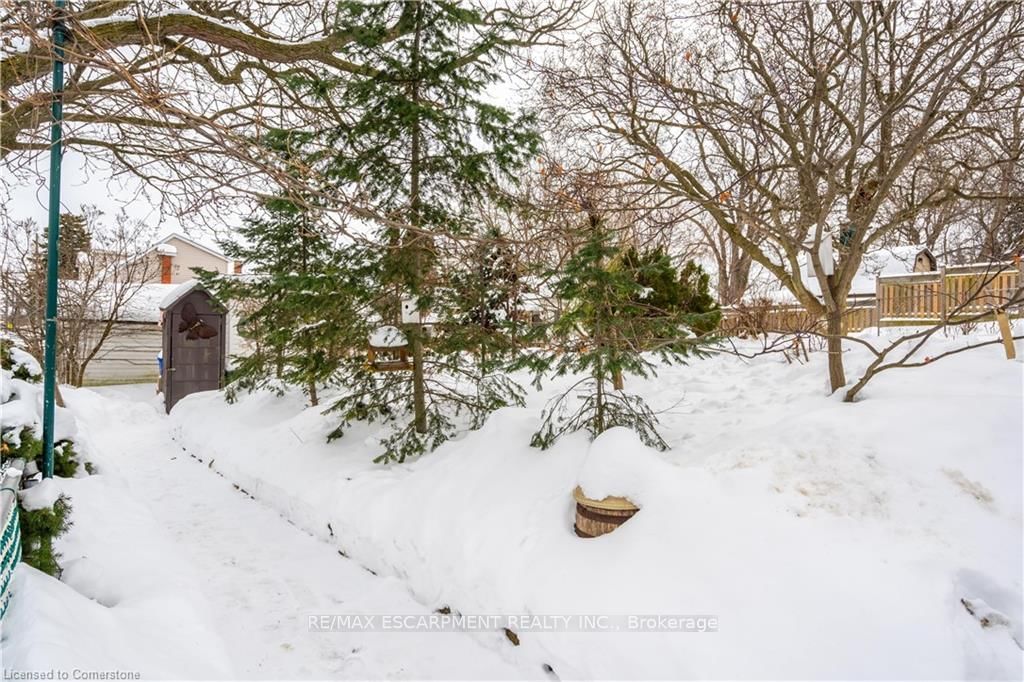
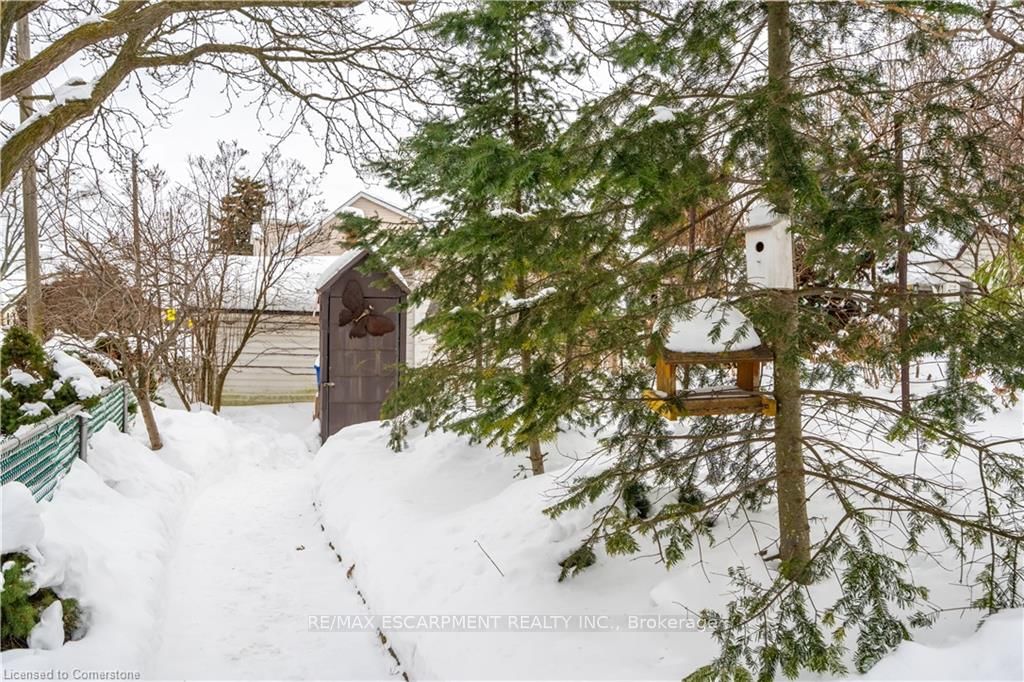
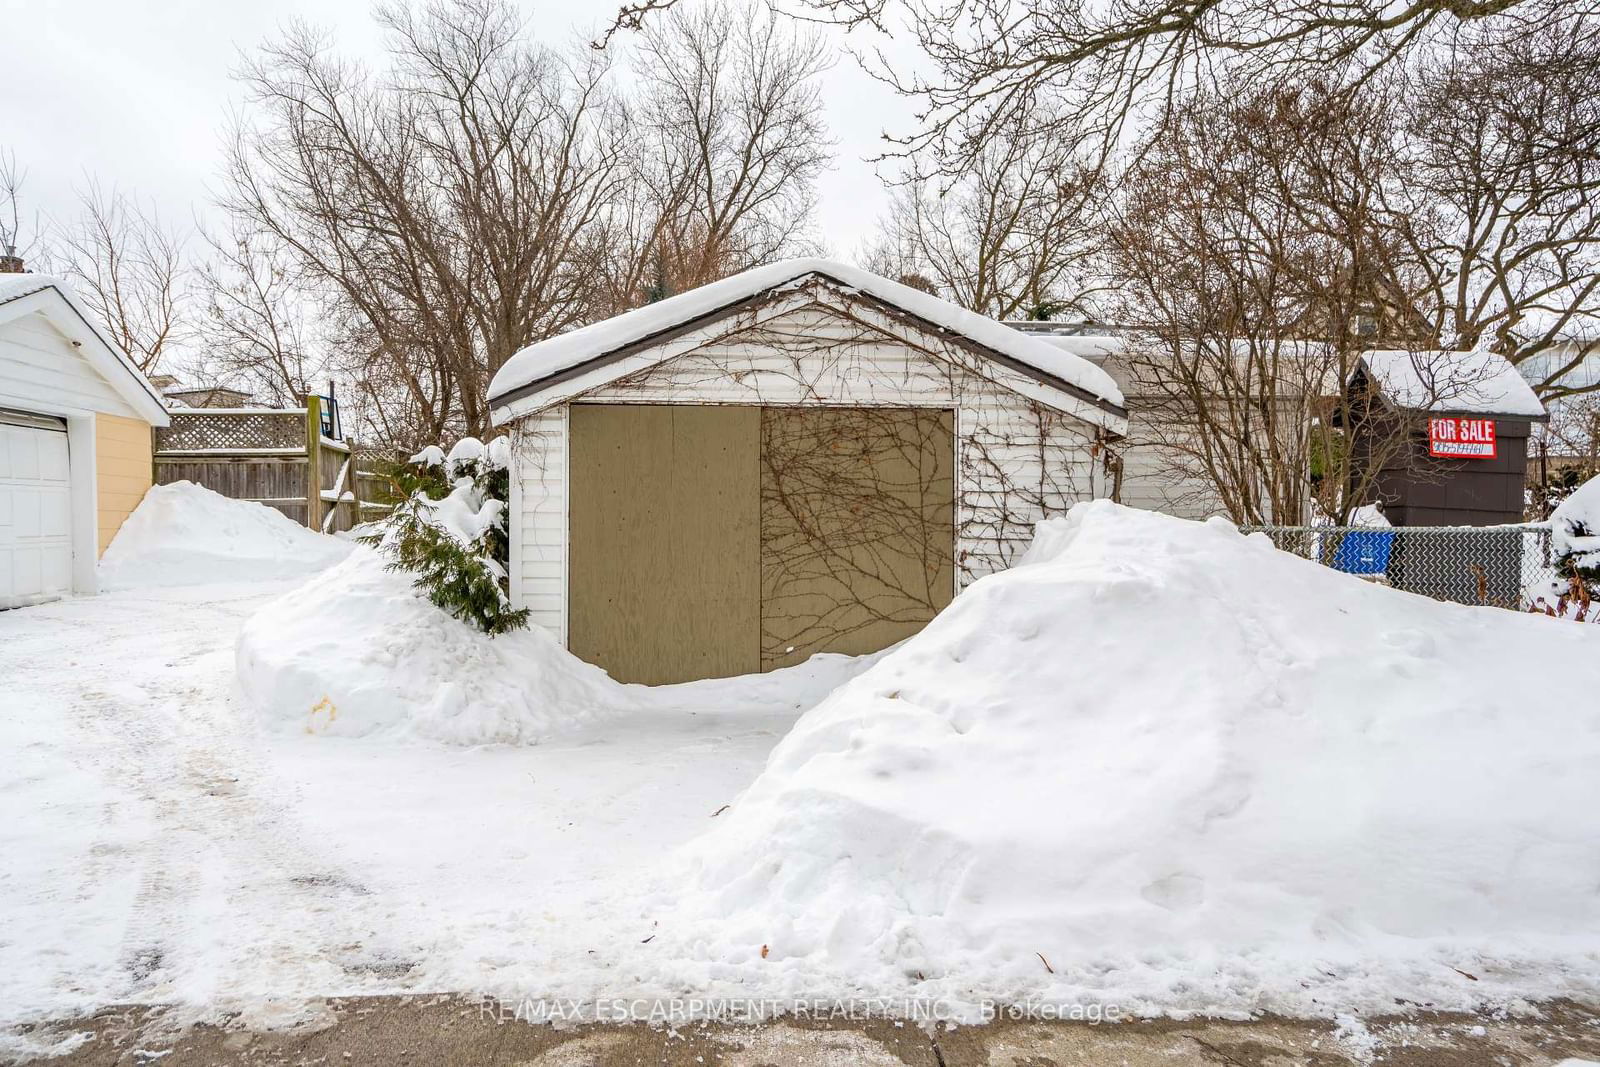
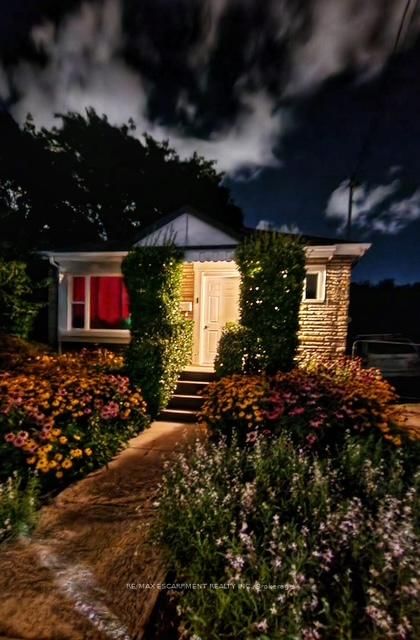
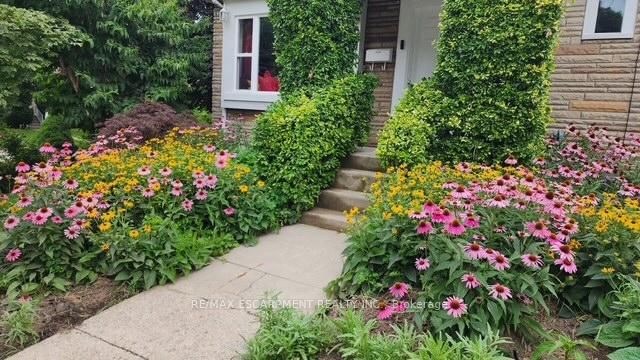
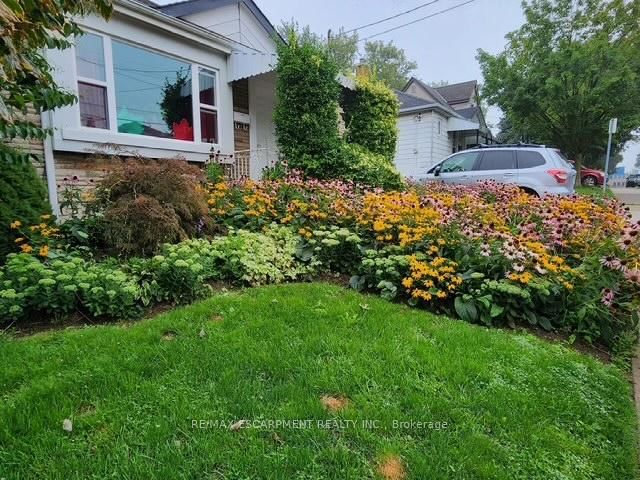
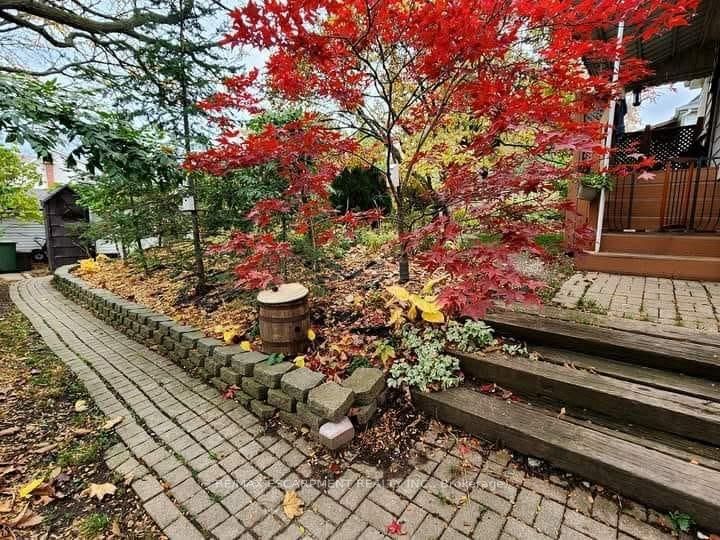
Attractive 2+1 Bedrm, 2 Full Bath Bungalow w/Approx 1200 sqft Fin Living Area. Nestled on 50x114ft Corner Lot. Home can be easily divided for In-Law, or Investment w Rear Door access to Fin Basemnt. Located in the sought after Inch Park neighbourhood near Shopping, Schools, and easy Highway Access for Commuters. The Main Floor features a Foyer that flows into a Bright Sun-filled Living Room with Large Picture Window and Attractive Wood-toned Laminate flooring, 2 Spacious Bedrooms with Large Windows and Closets and a Bright updated 4-Piece Bath with Brand New Toilet and Pedestal Sink & Storage Closet. The Eat-in Galley Kitchen with Breakfast Bar, Ceramic Backsplash, Convenient Back Door Exit to Deck, and a Large Window framing a Spectacular view of the Professionally Designed Private Botanical Backyard Retreat that has become the Envy of the neighbourhood! The Staggered Blooms ensure Visual Interest throughout the seasons and feature a Majestic Magnolia tree and various fruit trees including Plum, Pear, and Cherry. The property includes an existing older garage, 2 sheds (10x10ft and 12x8ft) plus additional parking for 2 more vehicles in the front driveway. The Lower Level offers ceramic floors, a Recreation Room, 3rd Bedroom with a Spacious Ensuite Bath Boasting an Oversized Soaker Tub, and a generous Utility/Laundry/Storage Room. All room sizes and square footage approximate. Updates Include: Vinyl Clad easy clean Tilt Windows, Pot Lights, 40 Yr Shingles 2021, Furnace and Central Air 2010, Updated Main Bath, Attractive Wood Toned Laminate flooring in Living room and Bedrooms and kitchen, 100 AMP breakers, All Copper Wiring, Tankless (Rheem) Water Heater 2019 ($59.64/month -assumable)
Foyer
Living
Kitchen
Prim Bdrm
Br
Bathroom
Rec
Br
Bathroom
Utility
Laundry
The graph below compares the average list price and average sale price of homes in this neighborhood by month for the last 24 months. When average sale price is greater than average list price, this may suggest a buyer's market. When average sale price is lower than the average list price this may suggest a seller's market.
The graph below illustrates the average days on market for homes in this neighborhood. The yellow area may indicate a buyer's market, the green area may indicate a balanced market and the red area may indicate a seller's market.
Sales Representative, Century 21 People’s Choice Realty Inc., Brokerage
(647) 576 - 2100